US States By Population
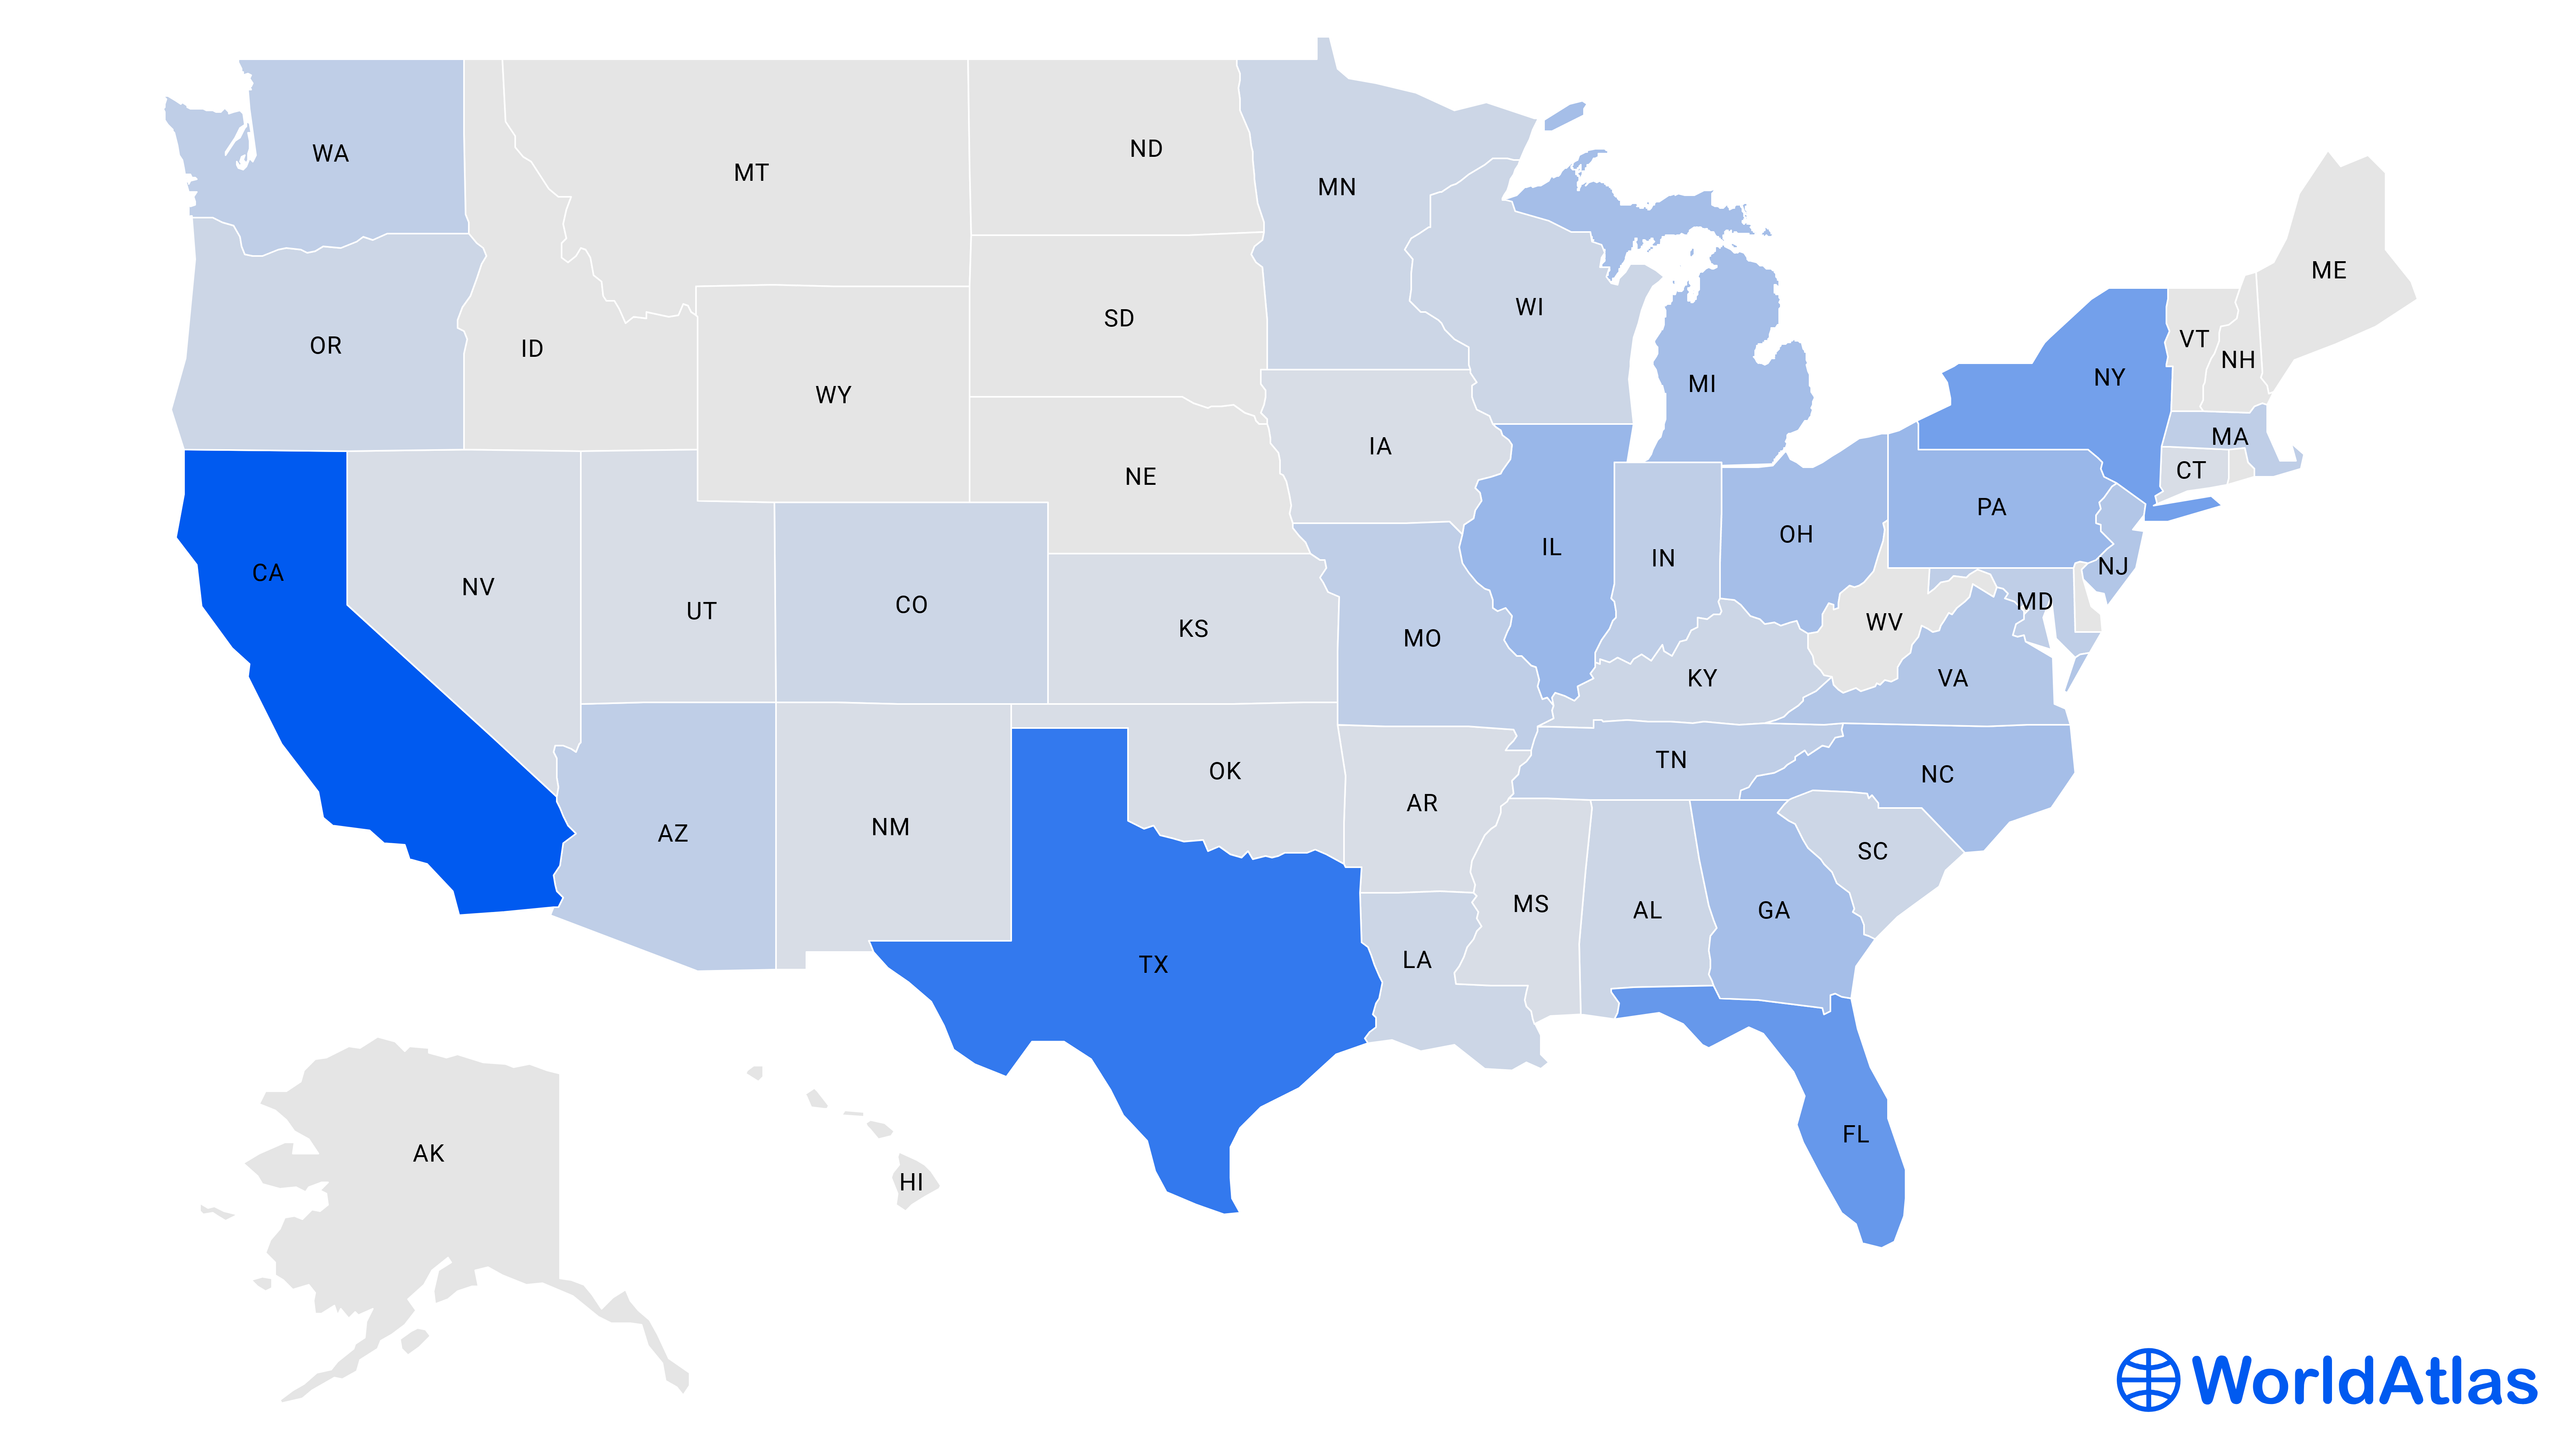
In the United States, a nation comprised of 50 states and multiple territories, the distribution of its population comprising of 333,287,557 varies significantly. According to the US Census Bureau, it has been noted that the ten most populated states share a direct border with significant water bodies. The correlation between access to such water bodies and robust infrastructure appears crucial in supporting large populations. It is also worth highlighting that five separate US territories and the District of Columbia, despite not being states, make a significant contribution to the country's demographic landscape.
Total Population Of US States
| Rank | State | Population Estimates |
|---|---|---|
| 1 | California | 39,029,342 |
| 2 | Texas | 30,029,572 |
| 3 | Florida | 22,244,823 |
| 4 | New York | 19,677,151 |
| 5 | Pennsylvania | 12,972,008 |
| 6 | Illinois | 12,582,032 |
| 7 | Ohio | 11,756,058 |
| 8 | Georgia | 10,912,876 |
| 9 | North Carolina | 10,698,973 |
| 10 | Michigan | 10,034,113 |
| 11 | New Jersey | 9,261,699 |
| 12 | Virginia | 8,683,619 |
| 13 | Washington | 7,785,786 |
| 14 | Arizona | 7,359,197 |
| 15 | Tennessee | 7,051,339 |
| 16 | Massachusetts | 6,981,974 |
| 17 | Indiana | 6,833,037 |
| 18 | Missouri | 6,177,957 |
| 19 | Maryland | 6,164,660 |
| 20 | Wisconsin | 5,892,539 |
| 21 | Colorado | 5,839,926 |
| 22 | Minnesota | 5,717,184 |
| 23 | South Carolina | 5,282,634 |
| 24 | Alabama | 5,074,296 |
| 25 | Louisiana | 4,,590,241 |
| 26 | Kentucky | 4,512,310 |
| 27 | Oregon | 4,240,137 |
| 28 | Oklahoma | 4,019,800 |
| 29 | Connecticut | 3,626,205 |
| 30 | Utah | 3,380,800 |
| 31 | Iowa | 3,200,517 |
| 32 | Nevada | 3,177,772 |
| 33 | Arkansas | 3,045,637 |
| 34 | Mississippi | 2,940,057 |
| 35 | Kansas | 2,937,150 |
| 36 | New Mexico | 2,113,344 |
| 37 | Nebraska | 1,967923 |
| 38 | Idaho | 1,939,033 |
| 39 | West Virginia | 1,775,156 |
| 40 | Hawaii | 1,440,196 |
| 41 | New Hampshire | 1,395,231 |
| 42 | Maine | 1,385,340 |
| 43 | Montana | 1,122,867 |
| 44 | Rhode Island | 1,093,734 |
| 45 | Delaware | 1,018,396 |
| 46 | South Dakota | 909,824 |
| 47 | North Dakota | 779,261 |
| 48 | Alaska | 733,583 |
| 49 | Vermont | 647,064 |
| 50 | Wyoming | 581,381 |
Data taken from the United States Census Bureau in June, 2023.
The Largest State By Population Is California

A little less than one of every eight United States residents lives here in the Golden State. World Population Review’s statistics show that Cali is way ahead of Texas, with over 10 million more people. However, Texas is physically larger than California by about 100,000 square miles. In third-place, Florida has around 7.5 million less residents than Texas which is remarkable considering its size, in comparison. Certainly, Florida's 270 degree access to both the Gulf and Atlantic, as well as pleasant and even terrain, are important factors.
So why is California home to so many? At the start of the 1900s, there were only two million people here. As people moved out west, the population grew to 10 million by the 1950s. Although the rate of growth has slowed, it certainly has not stopped. Migration here has shifted, though, and rather than being mostly domestic, more people move here from other countries: More than 10 million of the people who call California home are immigrants. This is more than any other state in the country. The majority of these immigrants hail from Mexico, the Philippines, China, Vietnam, India, El Salvador, and Korea. So in terms of cultural variety, California has the best of everything, from everywhere.
Here are some more 2023 Cali stats:
- 40.2% of California state residents are Latino
- 35.2% are white
- 15.9% are Asian American
- 6.5% are Black or African American
- 4.2% are multiracial
- Less than 1% are Pacific Islander or American Indian
The state sure is a melting pot, and also has some of the most famous cities in the world, including San Diego, Los Angeles, Santa Monica, and San Francisco. Natural beauty abounds here too, with Yosemite National Park, Lake Tahoe, Napa Valley, and Big Sur. Additional tourist attractions include Beverly Hills, Hollywood, Disneyland, Monterey, and Newport Beach. The weather here is also legendary, with plenty of high temperatures and sunshine year-round.
The Smallest State By Population is Wyoming

As the tenth-largest state in square miles, Wyoming has the smallest population at just 581,381. In fact, it has been called “a small town with a very long main street.” It is landlocked, with a landscape that is not as livable as other states. It has sparse rainfall, wide valleys and plans, flat, treeless basins, and rugged, high terrains. There are many large ranches here, which keep the towns and cities far apart.
On top of this, close to half of Wyoming’s land is used for grazing and not much else. The U.S. Government owns a lot of the state’s land, meaning that they control its mining, logging, and grazing. In a sense, the high populations of the US' coastal regions would be unsustainable without the agricultural support from states like Wyoming — it takes all kinds.

Comparing Land Area to Population
While a region's massive size (in square miles) may suggest a large population, this is not always the case. For instance, according to the data provided, Alaska ranks first in total land area with 665,384 square miles. However, it ranks near the bottom in terms of population with only 733,583 inhabitants. On the contrary, New Jersey, one of the smallest states by land area (ranked 47 with 8,723 square miles), houses a significantly larger population of 9,261,699. Hence, it becomes evident that a state's size does not necessarily correspond to its population. Other factors such as urbanization, economic opportunities, and livability can play substantial roles in population size.
The Populations of the Five US Territories and Washington, D.C.
| Other US Regions | Population |
|---|---|
| District of Columbia | 671,803 |
| Puerto Rico | 3,221,789 |
| Guam | 173,119 |
| U.S. Virgin Islands | 103,973 |
| Northern Mariana Islands |
58,584 |
| American Samoa | 54,834 |
Apart from the 50 states, the US has several territories whose inhabitants are American citizens, but these regions lack the same level of representation in the federal government. These territories were generally acquired as a result of military conflict, negotiations, or exploration.
One exception is the District of Columbia, now home to 671,803 people, which was established in 1790 as the nation's capital, formed from land donated by the states of Maryland and Virginia. It is not a state or under the jurisdiction of any state; rather, it is a physical representation of the Federal Government.
On the other hand, territories experienced specific circumstances to be occupied and considered as-such: for example, Puerto Rico, with a population of 3,221,789, became a U.S. territory following the Spanish-American War in 1898. It is possible that it will receive statehood, but that has been a disputed topic over the last few decades.