The Richest Countries In The World 2025
When measuring a nation’s prosperity, GDP per capita in purchasing power parity (PPP) often provides a nuanced view by accounting for both economic output and the relative cost of living. The "richest" countries on these lists can be surprisingly small in size or population, yet have highly specialized industries, robust financial sectors, or valuable natural resources. In many instances, these nations leverage their unique advantages, whether it’s Luxembourg’s potent finance and banking infrastructure or Qatar’s abundant petroleum reserves, to attain exceptionally high GDP per capita figures. Other significant examples include Singapore’s role as a global finance and trade hub and Norway’s strategic management of oil and gas revenues.
That said, larger economies with extensive diversification, like the United States, can also earn a spot among the highest earners per capita, thanks to their technological leadership, advanced service sectors, or globally impactful industries. Meanwhile, emerging producers such as Guyana highlight how recent resource discoveries can reshape an entire economic landscape in just a few years!
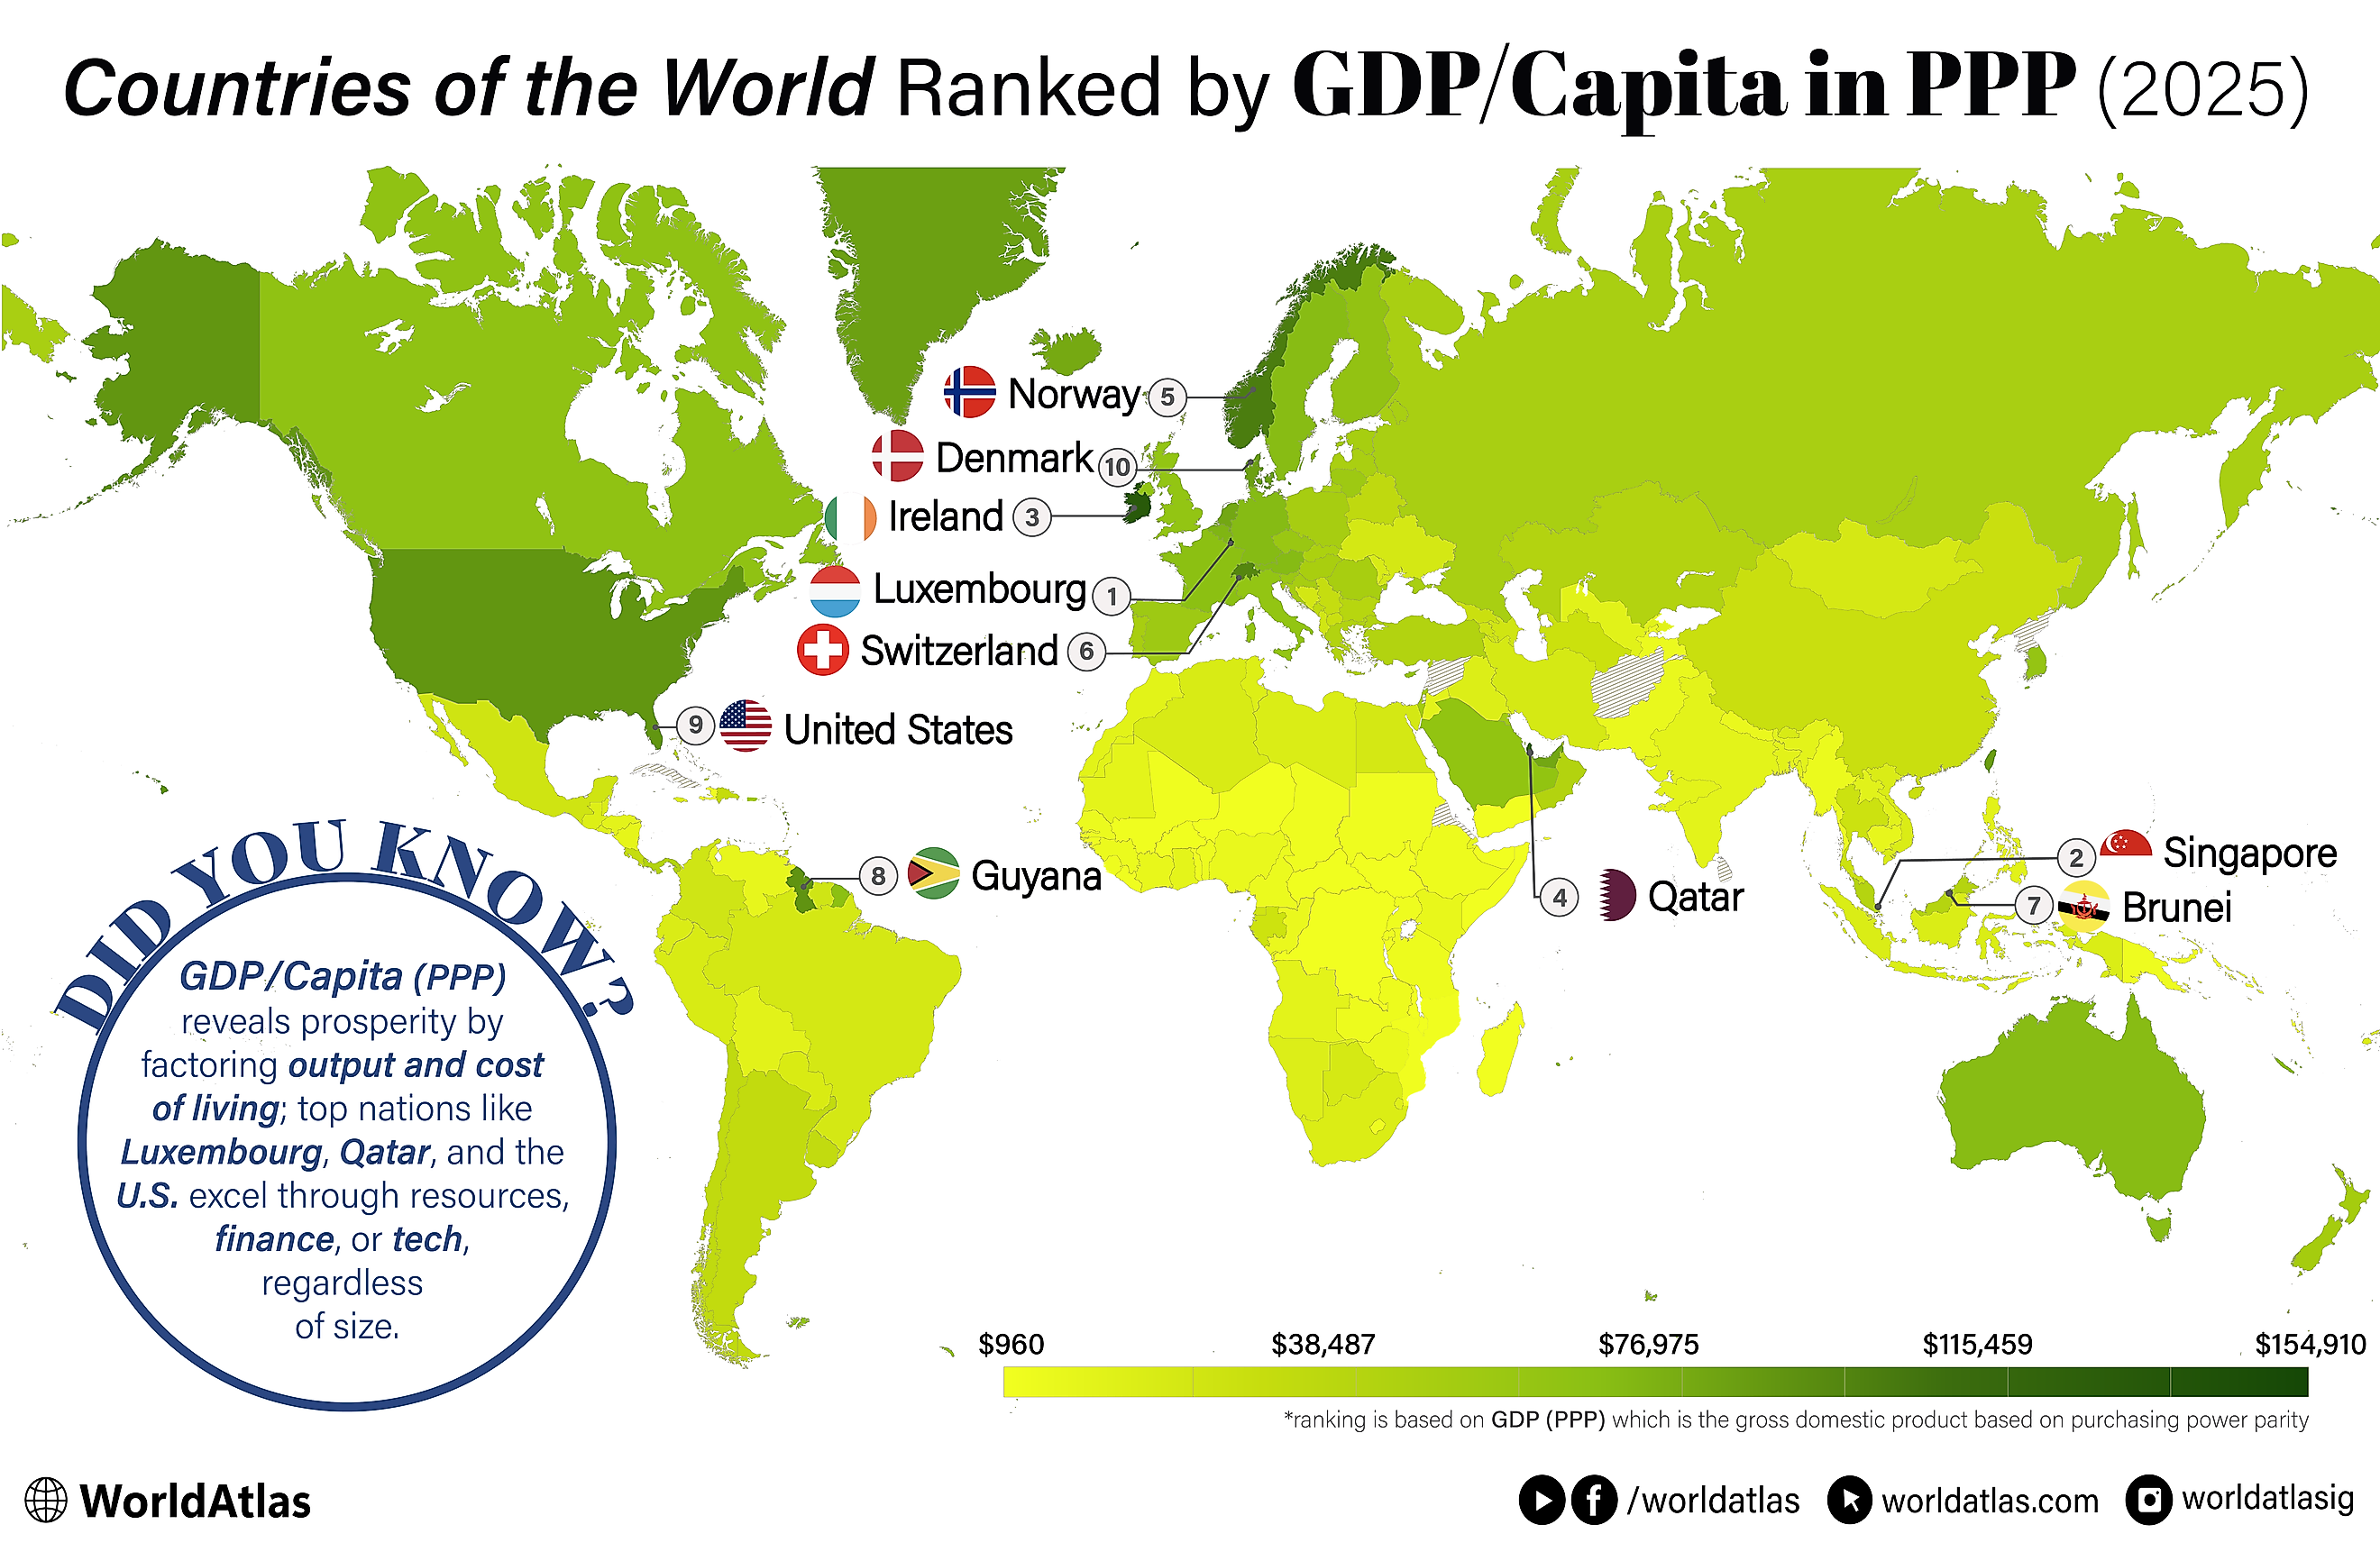
Below is a closer look at ten countries that top the global charts in GDP per capita (PPP) using data provided by the IMF for 2025. Luxembourg, Singapore, and Ireland stand out as the richest countries for 2025, with GDP/Capita in PPP of $154,910, $153,610, and $131,550, respectively. Each entry outlines the key factors, ranging from historical transformations and economic reforms to resource management and governmental policies, that have propelled these nations to their lofty positions on the world stage.
The 10 Richest Countries In The World
| Rank | Country | GDP/Capita (PPP) |
|---|---|---|
| 1 | Luxembourg | $154,914.9 |
| 2 | Singapore | $153,608.8 |
| 3 | Ireland | $131,548.4 |
| 4 | Qatar | $118,761.7 |
| 5 | Norway | $106,540.4 |
| 6 | Switzerland | $98,144.79 |
| 7 | Brunei | $95,038.77 |
| 8 | Guyana | $91,383.5 |
| 9 | United States | $89,677.89 |
| 10 | Denmark | $85,788.77 |
Jump to the list of all countries ranked by GDP/Capita (PPP)
1. Luxembourg - $154,914 GDP/Capita (PPP)

Luxembourg, known for its robust banking and finance sectors, has the highest per capita GDP (PPP) in the world as of 2025. Historically rural and isolated, Luxembourg transitioned from a dominant steel industry in the 19th century to a finance-driven economy. The country’s financial sector, including banking and fund administration, is heavily international, attracting businesses with its political stability, skilled workforce, and banking secrecy. This secrecy has made Luxembourg a haven for tax avoidance, although recent reforms have aimed to curb these practices.
The financial center, established significantly by the 1929 Holding Law, has evolved Luxembourg into a key player in international finance. Other economic sectors include telecommunications, with Luxembourg housing major broadcasting and satellite companies, and tourism, contributing significantly to the GDP. Despite a small agricultural sector, Luxembourg remains productive, heavily supported by EU subsidies. Additionally, Luxembourg has ventured into space resource extraction, creating a legal framework to foster this emerging industry.
2. Singapore - $153,608 GDP/Capita (PPP)

Singapore, a high-income economy, is recognized for its business-friendly regulatory environment and significant investments in infrastructure, education, healthcare, and public services. Since gaining independence in 1965, Singapore has transformed from a low-income to a high-income nation, experiencing remarkable GDP growth rates averaging about 7% annually.
This growth was initially fueled by rapid industrialization and manufacturing, which remains a key economic driver alongside the services sector. In 2023, Singapore's economy grew by 1.1%, with construction and services like accommodation and information and communications leading the growth. The "Singapore Green Plan 2030" was launched to promote sustainable development, aiming for net zero emissions by 2050. Singapore also leads in human capital development, ranking highest in the 2020 World Bank Human Capital Index. The government's ongoing commitment includes initiatives like Skillsfuture, enhancing workforce adaptability and skill development.
3. Ireland - $131,548 GDP/Capita (PPP)

The term "Celtic Tiger" refers to Ireland's economic boom between 1995 and 2007, during which its GDP grew significantly, marking a dramatic shift from being one of Europe's poorest countries to one of its wealthiest. This period saw an average annual GDP growth rate of 9.4% from 1995 to 2000.
Key factors contributing to Ireland's success included low corporate taxes, foreign investment, U.S. economic growth, EU membership, and social partnerships. During this time, Ireland attracted substantial foreign investments from major U.S. corporations due to its EU membership, low taxes, and skilled, English-speaking workforce. The economy diversified significantly with substantial developments in the information technology, pharmaceuticals, and financial services sectors. Additionally, significant investments were made in education, which bolstered the workforce's skills and contributed to the country's economic growth. This transformative era in Ireland's history is also characterized by a significant increase in infrastructure and housing development, supported by EU funds and global economic integration.
4. Qatar - $118,761 GDP/Capita (PPP)

Qatar's economy demonstrates significant growth and stability, driven primarily by its vast petroleum and natural gas reserves. These resources account for over 70% of government revenue, more than 60% of GDP, and about 85% of export earnings. Qatar is the world's third-largest natural gas exporter and has the third-largest natural gas reserves. In response to the fluctuating oil market and to promote economic sustainability, Qatar has been diversifying its economy through the Qatar National Vision 2030, which focuses on enhancing the private sector and developing a knowledge-based economy. This strategic shift includes substantial investments in infrastructure and education to reduce dependence on oil and gas. The financial sector remains robust, with proactive government measures to support banks and financial institutions. Despite past economic sanctions by neighboring countries, Qatar has maintained strong trade relations with major Asian markets, which has helped sustain its economic growth.
5. Norway - $106,540 GDP/Capita (PPP)

Norway, with a highly developed mixed economy, is marked by state ownership in strategic areas like petroleum and natural gas. As of 2025, its GDP is projected at $506.47 billion nominally and $597.42 billion by PPP, with a high GDP per capita of $90,320 nominally and $106,540 by PPP.
The economy is diversified across agriculture (1.6%), industry (34.7%), and services (63.5%), maintaining low unemployment and high standards of living. Norway's economy benefits significantly from its North Sea oil reserves, supporting its robust welfare system, which is underpinned by substantial revenues from oil and gas that contribute over 70% to the government revenue. Despite challenges from global business cycles, Norway’s economy shows steady growth, supported by a strong social security system and low poverty rates. The government actively manages considerable assets through sovereign wealth funds, emphasizing sustainable economic practices. Norway’s strategic economic planning focuses on energy, industry, and maintaining a competitive edge in the global market.
6. Switzerland - $98,144 GDP/Capita (PPP)

Switzerland, renowned for its wealth and high standard of living, is the epitome of economic prosperity, hosting 800,000 millionaires and accounting for 1.7% of the world’s wealthiest despite having only 0.1% of the global population. This affluence is attributed not merely to its famed banking sector but to a broader foundation of innovation, industrialization, and political stability.
Switzerland became an early industrialized nation, leading to significant economic growth from the late 19th to the early 20th century, with key industries including pharmaceuticals, machinery, and chemicals. The nation's strategy of fostering domestic production over cheaper imports has underpinned its economic success, although it contributes to higher living costs.
The country's political neutrality and stability have made it a safe haven for investors and wealthy individuals. The banking sector, crucial in the last century, has attracted substantial foreign capital, enhancing Switzerland's financial standing. Additionally, favorable inheritance laws and tax policies have facilitated wealth accumulation and retention among Swiss families.
7. Brunei - $95,038 GDP/Capita (PPP)

The economy of Brunei is heavily reliant on its petroleum and natural gas sectors, which dominate exports and contribute significantly to its GDP. In 2025, Brunei's GDP is estimated at $16.68 billion nominally and $42.82 billion by PPP. With a population of just under 459,000, the country has a high GDP per capita, ranking 32nd nominally and 7th by PPP globally. Brunei's economy benefits from stable growth projections, with an expected increase to 2.6% by 2026. The country's financial health is further supported by having no external debt and a government debt at just 2.3% of GDP.
Brunei is the third-largest oil producer in Southeast Asia and a significant exporter of liquefied natural gas, primarily to Japan and Korea. Despite its wealth, Brunei faces challenges due to its economic dependence on oil and gas, prompting efforts toward economic diversification. These include promoting foreign investment and developing sectors like agriculture, aquaculture, and petrochemicals, exemplified by the SPARK petrochemical hub and initiatives like the Brunei Halal brand to tap into global Muslim markets. However, the country continues to deal with the implications of fluctuating oil prices and production levels.
8. Guyana - $91,383 GDP/Capita (PPP)

Guyana's economy has undergone a remarkable transformation, particularly since the discovery of significant offshore oil reserves in 2015. By 2025, the country's GDP per capita reached $91,380 (PPP), with an average growth rate of 4.2% over the previous decade. The exploitation of oil has catalyzed this growth, propelling Guyana to a global spotlight with a GDP growth of 19.9% in 2021 alone, making it one of the fastest-growing economies worldwide.
The government has strategically reduced its role in the economy, encouraging foreign investment and privatizing state-owned enterprises, including those in the timber, rice, and fishing industries. Tax reforms and improved laws for mining and oil exploration have further bolstered economic stability and attractiveness to foreign investments.
Despite these advances, Guyana faces challenges such as heavy indebtedness, with significant reductions achieved through international negotiations like the HIPC initiative. The economy remains heavily reliant on its primary sectors: agriculture and mining, with emerging growth in oil production set to redefine its economic landscape. By 2024, oil production reached about 645,000 barrels per day, significantly enhancing the country's GDP and setting a trajectory for continued expansion in oil output. As it stands, Guyana's future growth is poised to be heavily influenced by its burgeoning petroleum sector, driving further economic diversification and potential sustainability challenges.
9. United States - $89,677 GDP/Capita (PPP)

The United States holds its position as the world's largest economy by nominal GDP in 2025, with a nominal GDP of $30.337 trillion and purchasing power parity (PPP) also at $30.337 trillion. It ranks first in nominal terms and second in PPP terms globally. The economy demonstrates a steady GDP growth, with an increase of 2.7% forecasted for 2025. The GDP per capita stands impressively at $89,670, both nominally and by PPP, placing the U.S. 7th and 9th respectively in global rankings.
A key component of the U.S. economy is its service sector, which accounts for 80.2% of the GDP by sector, supported by significant contributions from industry (18.9%) and agriculture (0.9%). The country's inflation rate is moderately stable at 2.9% as of 2024, with a population below the poverty line showing a decrease, highlighting a reduction in income inequality.
The U.S. excels in innovation and technology, boasting main industries like high technology, petroleum, steel, motor vehicles, aerospace, and telecommunications, among others. It remains a vital hub for financial and technological developments, with New York City being the principal fintech and financial center globally.
The labor market is robust with an employment rate of 62.6% in 2024 and an unemployment rate at 4.1% as of February 2025. The average gross salary reported is $5,605 monthly in 2023. The U.S. also leads in high-tech exports and maintains a dominant position in global finance and venture capital investments, further solidifying its economic stature on the world stage.
10. Denmark - $85,788 GDP/Capita (PPP)

Denmark, a high-income, advanced economy, leverages a service-dominated sector, which constitutes 80% of employment, with manufacturing accounting for about 11%. The country's GDP for 2025 stands at $431.23 billion nominally and $514.05 billion PPP, positioning it 37th and 52nd globally in respective terms. A robust GDP per capita of $71,978 (nominal) and $85,790 (PPP) ranks Denmark high internationally. Denmark adheres to the Nordic model, featuring high taxes and extensive government services, which sustain a strong social security framework, accounting for approximately 26.2% of GDP.
Denmark's economy is notably stable with a low Gini coefficient and a high Human Development Index. Despite choosing not to adopt the Euro, Denmark maintains a fixed exchange-rate system. Its economy is also marked by low unemployment rates and a high labor force participation rate, especially among women. Active labor market policies are significant, focusing on reducing youth unemployment and enhancing job readiness.
Trade is critical for Denmark, with significant exports including wind turbines and pharmaceuticals. The country has seen a transition from agriculture to a service-based economy over the centuries, today characterized by high-tech industries and a strong emphasis on renewable energy, particularly wind power. Denmark's fiscal policies are geared towards long-term sustainability, addressing potential future economic challenges due to demographic shifts.
Other Rich Regions

Macao SAR, Taiwan Province of China, and Hong Kong SAR are three regions renowned for their extraordinary wealth, ranking among the richest globally by GDP per capita (PPP), despite not being independent countries. Macao SAR, with a staggering GDP per capita of approximately 140,245.5 USD, has built a robust economy centered on tourism, gaming, and hospitality, transforming itself into a major international entertainment hub. In contrast, Taiwan, with a GDP per capita of about 82,614.61 USD, has a diversified economy with strengths in high-tech manufacturing, electronics, and innovation. This dynamic blend of industries has positioned Taiwan as a global leader in technology and industrial output.
Hong Kong SAR, registering a GDP per capita of around 78,716.52 USD, has long been celebrated as a premier global financial center. Its free-market policies, strategic location, and efficient regulatory framework have attracted multinational corporations and investors worldwide. Despite their different economic structures, these regions share common attributes: strong institutional frameworks, high levels of human capital, and deep integration into the global economy.
Their unique statuses, as Special Administrative Regions or politically complex provinces, allow them to exercise considerable economic autonomy while benefiting from broader national relationships.
Countries Ranked By GDP/Capita (PPP)
| Rank | Country | GDP/Capita (PPP) |
|---|---|---|
| - | Afghanistan | no data |
| - | Eritrea | no data |
| - | Lebanon | no data |
| - | Sri Lanka | no data |
| - | Syria | no data |
| 1 | Luxembourg | 154914.9 |
| 2 | Singapore | 153608.8 |
| * | Macao SAR | 140245.5 |
| 3 | Ireland | 131548.4 |
| 4 | Qatar | 118761.7 |
| 5 | Norway | 106540.4 |
| 6 | Switzerland | 98144.79 |
| 7 | Brunei Darussalam | 95038.77 |
| 8 | Guyana | 91383.5 |
| 9 | United States | 89677.89 |
| 10 | Denmark | 85788.77 |
| 11 | Netherlands | 83822.68 |
| * | Taiwan Province of China | 82614.61 |
| 12 | San Marino | 82578.76 |
| 13 | United Arab Emirates | 82000.37 |
| 14 | Iceland | 80318.31 |
| * | Hong Kong SAR | 78716.52 |
| 15 | Malta | 75821.66 |
| 16 | Belgium | 75187.07 |
| 17 | Austria | 74975.64 |
| 18 | Sweden | 74143.06 |
| 19 | Germany | 72660.47 |
| 20 | Australia | 71308.54 |
| 21 | Andorra | 69597.09 |
| 22 | France | 67657.61 |
| 23 | Finland | 67073.82 |
| 24 | Bahrain | 66966.5 |
| 25 | Saudi Arabia | 65884.71 |
| 26 | Korea, Republic of | 65581.6 |
| 27 | Canada | 64565.68 |
| 28 | United Kingdom | 64384.27 |
| 29 | Italy | 62603.05 |
| 30 | Cyprus | 62288.05 |
| 31 | Czech Republic | 59205.2 |
| 32 | Slovenia | 58153.25 |
| 33 | Spain | 56659.49 |
| 34 | Lithuania | 55995.4 |
| 35 | Israel | 55847.4 |
| * | Aruba | 55054.5 |
| 36 | Japan | 54906.86 |
| 37 | Poland | 54497.6 |
| 38 | New Zealand | 54038.01 |
| 39 | Kuwait | 51287.07 |
| 40 | Portugal | 51256.67 |
| 41 | Croatia | 51223.93 |
| * | Puerto Rico | 50342.86 |
| 42 | Romania | 49943.6 |
| 43 | Estonia | 49696.51 |
| 44 | Hungary | 49147.38 |
| 45 | Russian Federation | 48956.82 |
| 46 | Slovak Republic | 47438.53 |
| 47 | Latvia | 45447.11 |
| 48 | Greece | 43800.61 |
| 49 | Kazakhstan | 43610.17 |
| 50 | Malaysia | 43095.31 |
| 51 | Seychelles | 43070.41 |
| 52 | Panama | 42772.29 |
| 53 | Oman | 42361.9 |
| 54 | Türkiye, Republic of | 41913.65 |
| 55 | Bulgaria | 41505.74 |
| 56 | Bahamas, The | 38425.28 |
| 57 | Saint Kitts and Nevis | 37396.32 |
| 58 | Trinidad and Tobago | 36302.14 |
| 59 | Uruguay | 36013.96 |
| 60 | Maldives | 35984.3 |
| 61 | Chile | 34788.95 |
| 62 | Mauritius | 33954.42 |
| 63 | Montenegro | 33620.15 |
| 64 | Belarus | 33602.55 |
| 65 | Antigua and Barbuda | 32736.43 |
| 66 | Costa Rica | 31092.16 |
| 67 | Serbia | 30908.81 |
| 68 | Dominican Republic | 30710.06 |
| 69 | Argentina | 30381.57 |
| 70 | Georgia | 29533.15 |
| 71 | North Macedonia | 28720.33 |
| 72 | Saint Lucia | 28080.39 |
| 73 | China, People's Republic of | 28008.2 |
| 74 | Turkmenistan | 27669.54 |
| 75 | Thailand | 26416.43 |
| 76 | Mexico | 25556.56 |
| 77 | Azerbaijan | 25476.59 |
| 78 | Armenia | 24968.34 |
| 79 | Gabon | 24682.19 |
| 80 | Barbados | 23049.79 |
| 81 | Brazil | 22927.78 |
| 82 | Albania | 22729.72 |
| 83 | Bosnia and Herzegovina | 22610.56 |
| 84 | Colombia | 22193.96 |
| 85 | Suriname | 22104.08 |
| 86 | Egypt | 21608.94 |
| 87 | Grenada | 21369.09 |
| 88 | Botswana | 20797.62 |
| 89 | Ukraine | 20756.79 |
| 90 | Saint Vincent and the Grenadines | 20546.69 |
| 91 | Mongolia | 20514.33 |
| 92 | Equatorial Guinea | 20477.43 |
| 93 | Iran | 20368.82 |
| 94 | Moldova | 19909.46 |
| 95 | Dominica | 19417.86 |
| 96 | Palau | 19005.97 |
| 97 | Peru | 18388.59 |
| 98 | Algeria | 18342.74 |
| 99 | Bhutan | 18113.51 |
| * | Kosovo | 17835.47 |
| 100 | Libya | 17587.86 |
| 101 | Indonesia | 17520.28 |
| 102 | Paraguay | 17357.13 |
| 103 | Vietnam | 17348.93 |
| 104 | Ecuador | 16894.66 |
| 105 | Fiji | 16739.3 |
| 106 | Guatemala | 15385.55 |
| 107 | Belize | 15363.46 |
| 108 | Iraq | 15256.47 |
| 109 | Tunisia | 14717.78 |
| 110 | El Salvador | 13752.58 |
| 111 | Eswatini | 13604.98 |
| 112 | Philippines | 12913.37 |
| 113 | Jamaica | 12754.53 |
| 114 | Uzbekistan | 12224.49 |
| 115 | Namibia | 12199.88 |
| 116 | Cabo Verde | 12087.99 |
| 117 | India | 11937.8 |
| 118 | Bolivia | 11630.82 |
| 119 | Jordan | 11380 |
| 120 | Morocco | 11095.82 |
| 121 | Nauru | 10962.06 |
| 122 | Bangladesh | 10366.62 |
| 123 | Lao P.D.R. | 10112.55 |
| 124 | Angola | 9910.508 |
| 125 | Nicaragua | 9361.174 |
| 126 | Djibouti | 9168.626 |
| 127 | Venezuela | 8740.9 |
| 128 | Cambodia | 8677.668 |
| 129 | Mauritania | 8548.412 |
| 130 | Ghana | 8263.472 |
| 131 | Tonga | 8160.168 |
| 132 | Kyrgyz Republic | 8134.34 |
| 133 | Côte d'Ivoire | 8055.157 |
| 134 | Honduras | 7875.471 |
| 135 | Kenya | 7522.579 |
| 136 | Samoa | 7324.889 |
| 137 | Marshall Islands | 6991.762 |
| 138 | Pakistan | 6921.519 |
| 139 | Tuvalu | 6769.062 |
| 140 | Nigeria | 6706.266 |
| 141 | Congo, Republic of | 6575.469 |
| 142 | São Tomé and Príncipe | 6391.587 |
| 143 | Tajikistan | 5788.797 |
| 144 | Cameroon | 5764.117 |
| 145 | Nepal | 5613.554 |
| 146 | Senegal | 5476.126 |
| 147 | Zimbabwe | 5359.007 |
| 148 | Myanmar | 5330.054 |
| 149 | Timor-Leste | 4862.772 |
| 150 | Micronesia, Fed. States of | 4857.026 |
| 151 | Benin | 4740.51 |
| 152 | Guinea | 4535.432 |
| 153 | Zambia | 4428.822 |
| 154 | Tanzania | 4332.701 |
| 155 | Ethiopia | 4317.477 |
| 156 | Comoros | 3999.804 |
| 157 | Rwanda | 3975.983 |
| 158 | Uganda | 3868.299 |
| 159 | Kiribati | 3770.909 |
| 160 | Papua New Guinea | 3662.296 |
| 161 | Sierra Leone | 3655.402 |
| 162 | Gambia, The | 3649.815 |
| 163 | Togo | 3443.82 |
| 164 | Lesotho | 3355.499 |
| 165 | Guinea-Bissau | 3257.12 |
| 166 | Haiti | 3083.626 |
| 167 | Burkina Faso | 2986.122 |
| 168 | Mali | 2926.792 |
| 169 | Chad | 2909.915 |
| 170 | Vanuatu | 2876.436 |
| 171 | Sudan | 2700.716 |
| 172 | Solomon Islands | 2690.227 |
| 173 | Niger | 2084.064 |
| 174 | Madagascar | 2061.846 |
| 175 | Yemen | 2017.474 |
| 176 | Liberia | 2002.749 |
| 177 | Congo, Dem. Rep. of the | 1908.323 |
| 178 | Somalia | 1899.506 |
| 179 | Mozambique | 1786.539 |
| 180 | Malawi | 1764.67 |
| 181 | Burundi | 1008.62 |
| 182 | South Sudan, Republic of | 960.241 |
* Macoa and Hong Kong are both Special Administrative Regions of the People’s Republic of China. Taiwan Province of China is considered by the UN to be part of the PRC. Puerto Rico is an unincorporated territory of the United States. Aruba is a constituent country within the Kingdom of the Netherlands but not a UN member. Kosovo is recognized by many states but is not a UN member (status disputed.)
Discover More Rich Countries
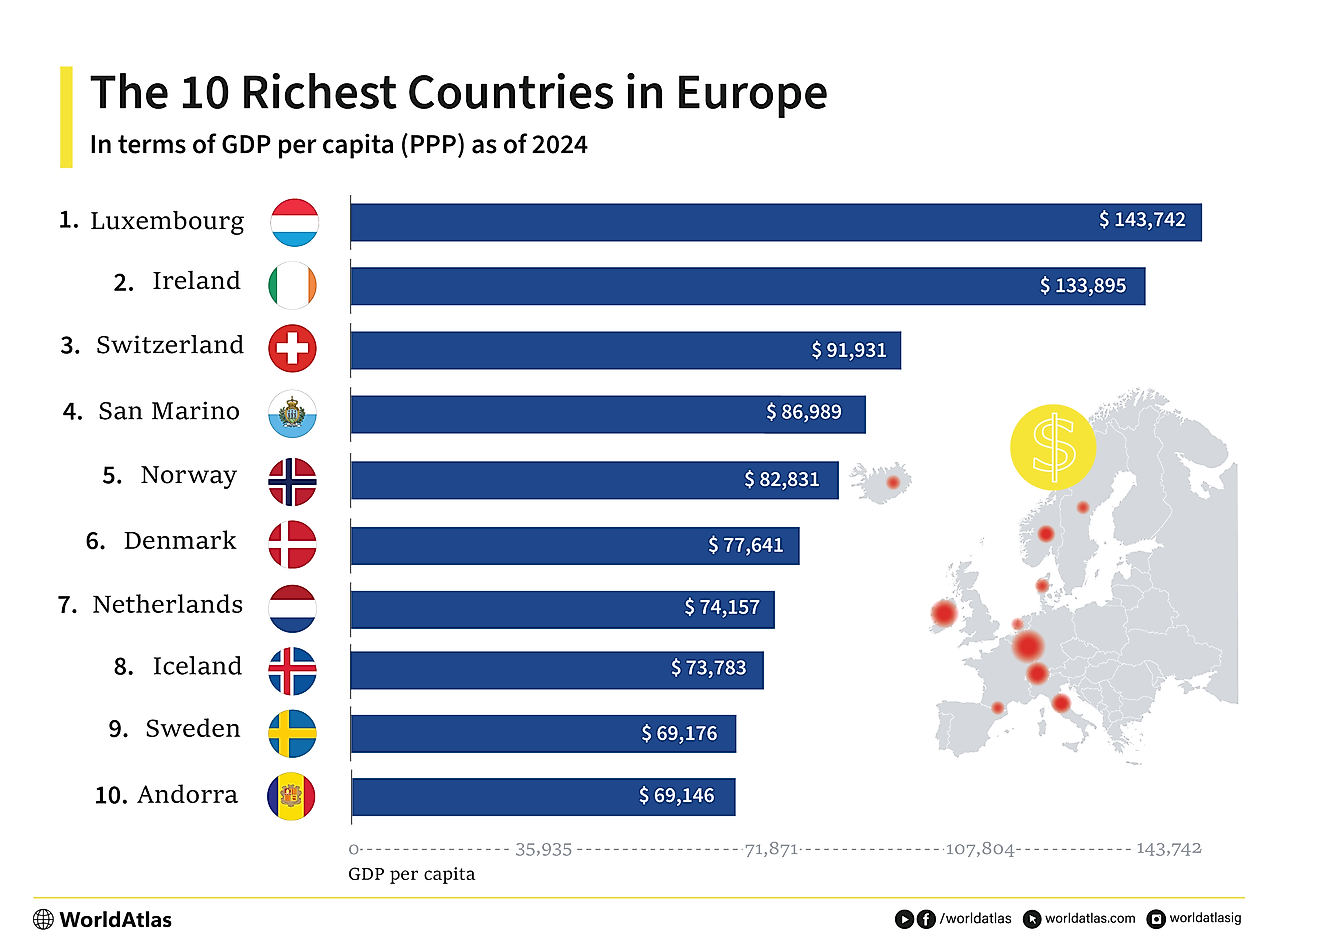
The Richest Countries In Europe
Luxembourg, Ireland, and Norway rank as the three richest countries in Europe for 2025 with a GDP/Capita in PPP of $154,914, $131,548, and $106,540, respectively.
The Richest Countries In Asia
Singapore, Qatar and Brunei are currently the richest countries in Asia for 2025, with GDP/Capita in PPP of $153,610, $118,760, and $95,040, respectively.
The Richest Countries In North America
The United States, Canada, and Panama are the richest countries in North America for 2025, with GDP/Capita in PPP of $89,680, $64,570, and $42,770, respectively.
The Richest Countries In South America
Guyana, Uruguay, and Chile are the richest countries in South America for 2025, with GDP/Capita in PPP of $91,380, $36,010, and $34,790, respectively.
The Richest Countries In Africa
Seychelles, Mauritius, and Gabon are the richest countries in Africa for 2025, with GDP/Capita in PPP of $43,070, $33,950, and $24,680, respectively.
The Richest Countries In South Asia
The Maldives, Bhutan and India are the richest countries in South Asia for 2025, with GDP/Capita in PPP of $35,980, $18,110, and $11,940, respectively.