12 Countries With The Worst GNI Growth Per Capita

Gross National Income (GNI) is the combined sum of foreign and domestic yield received by employed citizens of one country. It is the gross domestic product (GDP) that includes factor incomes of foreign residents less earnings of nonresidents in the national economy. GNI per capita is the common income of the employed citizens of a country. The growth rate of these incomes is based on constant local currency.
Stagnating and Declining Gross National Income
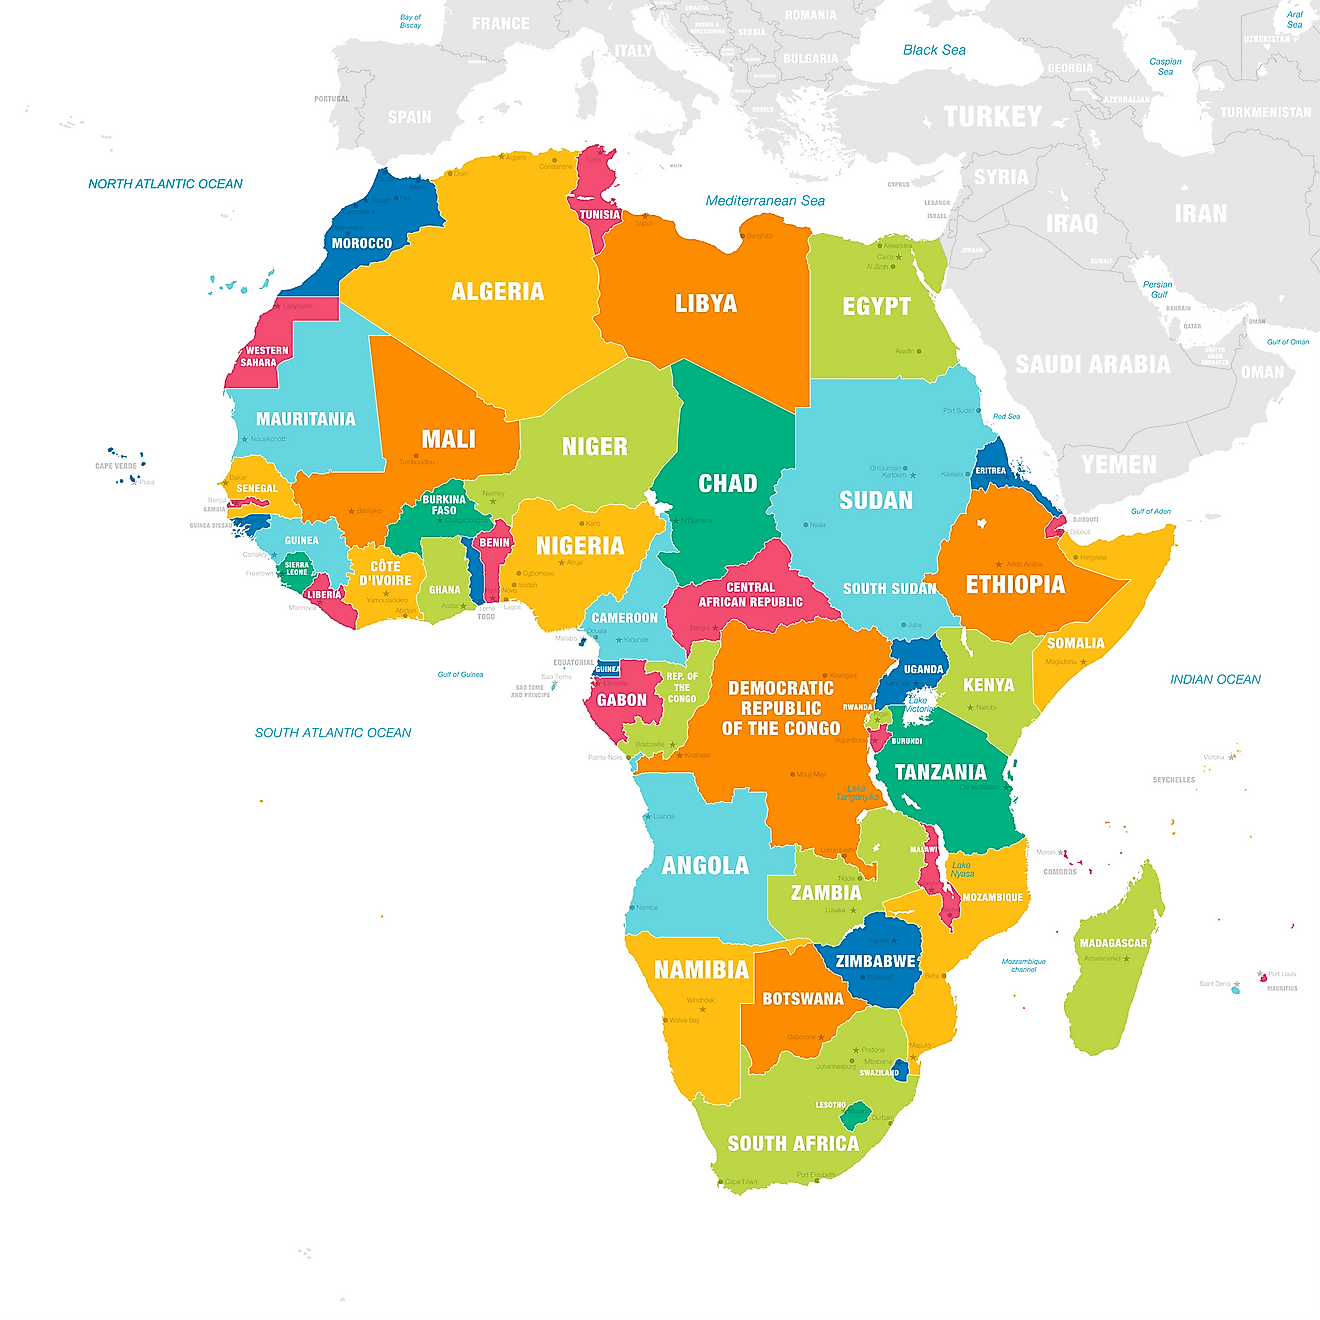
In today's global economy, there are developed and developing countries alike struggling to achieve GNI per capita growth. There are a number of economists who reason that the cause of declining and stagnating GNI is unmanageable prolonged inflation. Another reason they put forward is low productivity plus GNP stagnation. These two factors plus several other factors that may be affecting a country's economic growth also affects its gross national income. Population growth rate, health, education, and skills of the people all affect the GNI. Other factors that contribute to the GNI growth rate includes communication, transportation, and energy systems. Fair wages and prices for goods and services are two other important factors. The following data is taken from the 2014 World Bank GNI per capita growth chart, with growth rate being defined as change occurring over time. It is not only about change, but also the direction and the percentage of change. The negative reverse trend in the 2014 World Bank Data showing negative GNI growth has been affected by the global recession. Lower investments and lower exports have marked the global recession. Ongoing conflicts in some of the countries is another factor. The following countries showed a negative trend in its GNI per capita growth. Libya exhibited a slide of -21.0% in its GNI per capita growth due to internal conflict. Equatorial Guinea, a developing and poor country has a negative 6.3% GNI growth rate. Oman, an open-economy middle-income country with a low oil reserve has a score of -5.7% GNI growth rate. Kuwait, an oil rich country bouncing back from the gulf War has an unexpected -5.0% GNI growth rate. South Sudan, a newly independent country with large oil reserves shows a -4.6% GNI growth rate. Japan shows a negative 3.4% GNI growth rate although it is an industrialized country. Palestine has a -3.2% GNI growth rate which is understandable due to its perennial conflict with Israel. Guinea, a poor and developing country has -2.6% GNI growth rate. Iceland, an export-driven economy with free trade policy shows a -1.9% GNI growth rate. Cyprus, was affected with the Greek financial crisis, has a -1.8% GNI growth rate. Switzerland one of the richest countries in the world has -1.8% GNI growth rate. Bahamas, an island nation has a tourist-oriented economy offering banking and financial services yet has a -1.5% GNI growth rate.
Differentiating Gross National Product Vs. Gross National Income
Gross national product (GNP) and gross national income (GNI) are similar for industrialized and developing countries with high output and trade. Income received versus payments paid to other nations does not show a big difference and as a result, these two factors have a way of balancing each other. GNI is important in categorizing countries into low, middle, or high income. The data in this method easily gives a country's economic capability and development. However, GNP and GNI do not show how income is distributed in a particular country nor the buying power of that income.
12 Countries With The Worst GNI Growth Per Capita
| Rank | Country | Percent Annual Growth in Gross National Income Per Capita |
|---|---|---|
| 1 | Libya | -21.0% |
| 2 | Equatorial Guinea | -6.3% |
| 3 | Oman | -5.7% |
| 4 | Kuwait | -5.0% |
| 5 | South Sudan | -4.6% |
| 6 | Japan | -3.4% |
| 7 | Palestine | -3.2% |
| 8 | Guinea | -2.6% |
| 9 | Iceland | -1.9% |
| 10 | Cyprus | -1.8% |
| 11 | Switzerland | -1.8% |
| 12 | Bahamas | -1.5% |

