Incarceration Rates By State

- The US has the highest incarceration rate in the world, at 655 prisoners per 100,000 people.
- Oklahoma, Louisiana, and Mississippi hold the highest incarceration rates nationwide, with a respective 1,079, 1,052, and 1,039 per 100,000 people in jail.
- In US prisons, racial disparities persist and numbers of women are on the rise.
The US is the country with the most incarcerated prisoners in the world, by far, with a whopping 655 prisoners per 100,000 people. The country is home to 4.25% of the world's population, yet around 20% (or 2.2 million) of the 10.35 million incarcerated people worldwide are American. To compare, other countries have rates of under 300 prisoners per 100,000 population. As of 2018, Oklahoma, Louisiana, and Mississippi hold the highest incarceration rates nationwide, with a respective 1,079, 1,052, and 1,039 people per 100,000 people in jail. The fact is, the US, particularly the southern states, experienced a mass incarceration boom in the 1980s and rates have increased exponentially.
Why does the US have such a high incarceration rate?
Oddly enough, these high incarceration rates do not necessarily correlate to higher crime levels. Instead, the main reason for such a high incarceration rate is the long amount of time American inmates are kept in prison. State prisons hold over 1.3 million people, and over 600,000 are in local jails, both of which contain a significant portion of inmates who have not yet been convicted of a crime. When it comes down to it, money is often the deciding factor of who stays imprisoned and who gets their freedom back. Wealthier Americans who get arrested and sent to jail can post bail and get out, while those unable to afford bail sit behind bars until the courts are ready for them or work with a bail bond agent (usually still at a large cost).
Plus, it is tough to get out of the criminal justice system once inside it. In 2016, the United States Sentencing Commission studied over 25,000 federal offenders over eight years and found almost half were arrested again for another crime or for violating supervision conditions. Within two years, about half of these offenders got in trouble with the law again. One study indicated that first-time offenders who have never had contact with law enforcement were 11.7 percent less likely to re-offend than those who already had contact with law enforcement before their arrest.
Another reason for the country's high incarceration rate is the war on drugs. A fifth of the country's incarcerated population (about 456,000 people) is imprisoned for drug-related charges. Someone in the US is arrested for drug possession every 25 seconds, which has tripled since 1980. This staggering statistic has reached 1.3 million arrests per year in 2015 and is six times the number of arrests related to the sale of drugs.

Racial disparities persist in US prisons
It is three times more likely that First Nations youth get held in a juvenile detention facility than caucasian youth do. While statistics like this may sound horrifying, it is not anything new that a disproportionate amount of American racial minority groups are imprisoned. This is especially true for African Americans, both historically and to this day. It has been reported that one out of every 10 African American men in their thirties is imprisoned on any given day. Although African Americans comprise just 12% of the total US population, the state and federal prison population is made up of about 33% African-American people. Compare this to Caucasian people, representing about 64% of American adults but only 30% of prisoners. However, the good news is this trend has been decreasing over the last decade: as of the end of 2017, there were about 39,400 more African-American than Caucasian prisoners, whereas in 2007 this number was a staggering 58% higher, at 93,100.

Women in prison are on the rise
In recent times, the fastest-growing portion of the incarcerated population in the US has been women. A 2019 report indicates there are about 231,000 women locked up in the US, 200,000 of whom are in local or state facilities.
You might be surprised to learn that over the past few decades, the annual rate at which women are being incarcerated compared to their male counterparts has doubled. Between 2016 and 2017, even when overall populations of jails declined, the number of incarcerated women increased by over 5%. Reasons for this are not confirmed, but possibilities include more arrests of women (though, seemingly contradicting the previous statistic from the same reliable source, Prison Policy Initiative, women's arrests went down by 0.7% in 2016-2017), long case processing times, pre-trial detention, probation or parole violation punishments, long jail sentences, or a combination of any or all of these things.
While it is true that some progress to slowing or reversing the growth of state prison populations since their 2009 peak has occurred, it has not been equal among genders and has impacted fewer women than men. The number of incarcerated men in state prisons decreased over 5% between 2009 and 2015, while this occurred for just 0.29% of women. We still have a way to go to address mass incarceration in the United States, its disproportionate effect on visible minorities, and the intergenerational trauma created when mothers and fathers are imprisoned.
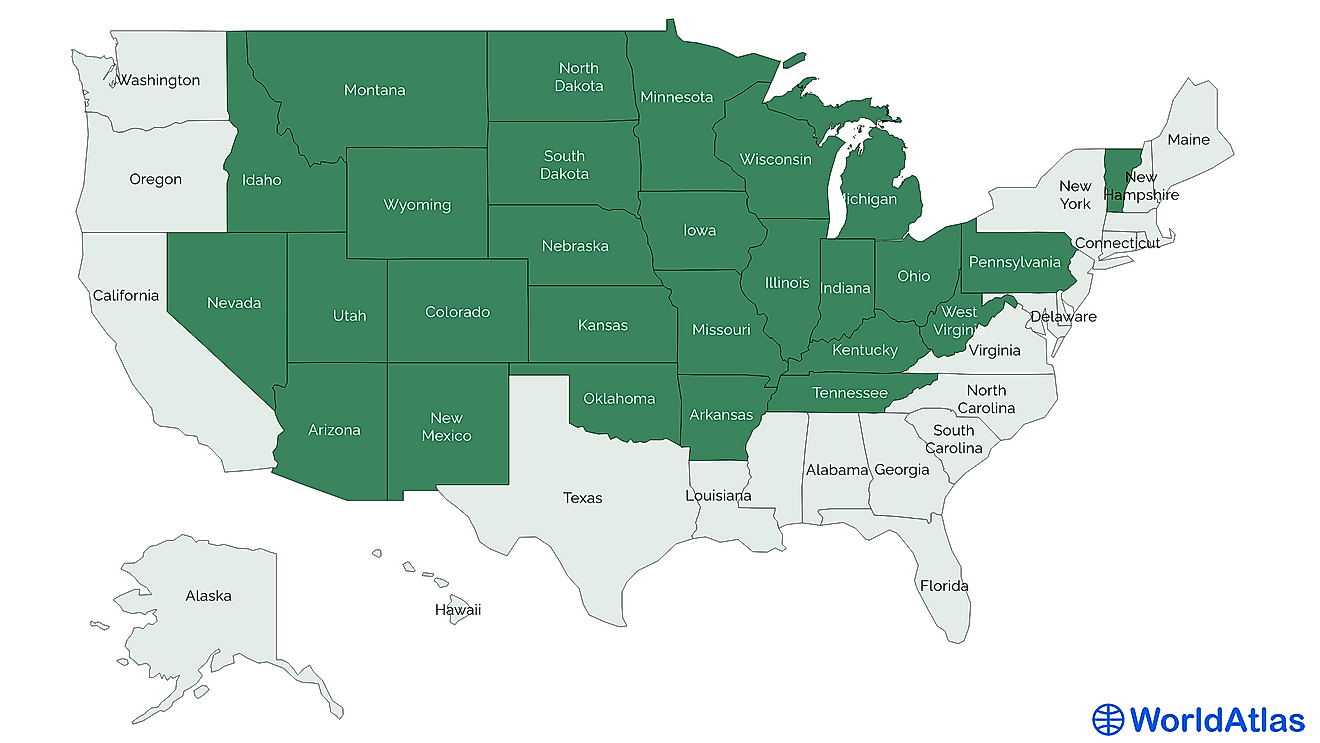
Incarceration Rates By State
| Rank | State | 2018 Incarceration Rate per 100,000 people |
|---|---|---|
| 1 | Oklahoma | 1,079 |
| 2 | Louisiana | 1,052 |
| 3 | Mississippi | 1,039 |
| 4 | Georgia | 970 |
| 5 | Alabama | 946 |
| 6 | Arkansas | 900 |
| 7 | Texas | 891 |
| 8 | Arizona | 877 |
| 9 | Kentucky | 869 |
| 10 | Missouri | 859 |
| 11 | South Dakota | 855 |
| 12 | Tennessee | 853 |
| 13 | Wyoming | 842 |
| 14 | Florida | 833 |
| 15 | New Mexico | 829 |
| 16 | Virginia | 779 |
| 17 | Nevada | 763 |
| 18 | Delaware | 756 |
| 19 | South Carolina | 754 |
| 20 | Idaho | 734 |
| 21 | Montana | 726 |
| 22 | Pennsylvania | 725 |
| 23 | Indiana | 723 |
| 24 | Kansas | 698 |
| 25 | Alaska | 691 |
| 26 | West Virginia | 690 |
| 27 | Ohio | 679 |
| 28 | Wisconsin | 676 |
| 29 | Michigan | 641 |
| 30 | North Carolina | 639 |
| 31 | Colorado | 635 |
| 32 | North Dakota | 596 |
| 33 | Maryland | 585 |
| 34 | Oregon | 582 |
| 35 | California | 581 |
| 36 | Nebraska | 577 |
| 37 | Iowa | 568 |
| 38 | Illinois | 564 |
| 39 | Hawaii | 487 |
| 40 | Washington | 480 |
| 41 | Connecticut | 468 |
| 42 | New York | 443 |
| 43 | Utah | 439 |
| 44 | New Jersey | 407 |
| 45 | New Hampshire | 373 |
| 46 | Minnesota | 364 |
| 47 | Maine | 363 |
| 48 | Rhode Island | 361 |
| 49 | Vermont | 328 |
| 50 | Massachusetts | 324 |
