Mormon Population By State

- Mormonism is a branch of Christianity, with a few key differences in their beliefs.
- The Church of Jesus Christ of Latter-day Saints is the full name of this religious branch.
- Utah is the state with the most Mormons in the United States.
The Church of Jesus Christ of Latter-day Saints, commonly referred to as the LDS Church or as Mormonism, is a world religious and cultural movement. It was founded in 1830 by Joseph Smith. The Book of Mormon is the sacred text of Mormonism. As Mormons believe in Jesus Christ, they are considered to be Christians. In 2018, there were 16,118,169 members worldwide with the highest population found in the United States at 6,592,195 members. The state of Utah has the highest percentage of Mormons.
Mormon Population in America by State
The states with the largest populations of Mormons are those within the Mormon Corridor, an area in the Western United States heavily settled by Mormons in the late 19th century. Utah, Idaho, and Wyoming have the largest Mormon populations in the United States. The remainder of the states have Mormon populations of less than 11% of their total populations. The lowest number of Mormons is found in New Jersey where they make up only 0.37% of the total population.
Mormon Population in Utah
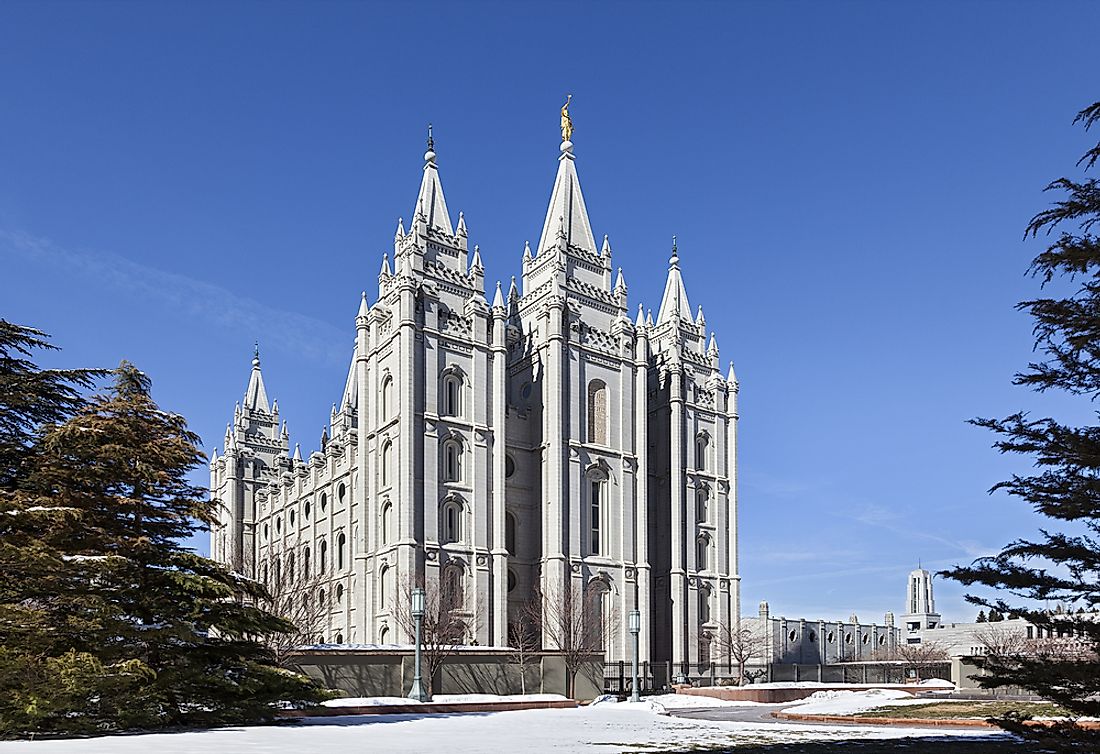
Mormons in Utah account for 67.70% of its population. A total of 2,065,808 Mormons live in Utah. Utah State is home to 16 Mormon temples, including the world's largest Mormon temple (pictured above). The Salt Lake Temple, located at Temple Square in Salt Lake City, Utah is the largest LSD temple by floor area at 253,015 sq ft. Mormons arrived in Salt Lake City via the Mormon Trail when the group was expelled from Missouri and Illinois in the 1830s and decided to head west, eventually settling in the late 1840s in what would become Salt Lake City.
Mormon Population in Idaho
The 2nd largest Mormon population in America is found in Idaho. The number of Mormons is approximately 444,614 people which translates to 26.42% of the total population. There are 4 temples used by Mormons in Idaho. The Mormon influence is mostly in the eastern parts of Idaho.
Mormon Population in Wyoming
Wyoming has the 3rd highest numbers of Mormons in America. The history of Mormons in Wyoming dates back to 1900 when establishments were set up in the towns of Byron and Cowley. It is also around the same time that the Mormons set up camp in Utah and Idaho. Today, there are 67,505 Mormons in Wyoming. They represent 11.53% of the state’s population. Wyoming has 157 congregations with one mission camp.
Comparison Between Mormonism and Christianity
One of the differences between Mormonism and other branches of Christianity is that Mormons do not believe Christians’ teaching on the presence of the Trinity. Furthermore, Mormons believe that God created the world using existing matter and not out of nothing, as Christians believe. The third difference is that Mormons believe that the second coming of Christ will be in the United States. However, Christians believe that when Jesus Christ appears again, he will appear in the heavens and everyone will see him.
Mormon Population By State
| Rank | State | Estimated Mormon Population | Total State Population | Percentage of Mormon Residents |
|---|---|---|---|---|
| 1 | Utah | 2,065,808 | 3,051,217 | 67.70% |
| 2 | Idaho | 444,614 | 1,683,140 | 26.42% |
| 3 | Wyoming | 67,505 | 585,501 | 11.53% |
| 4 | Nevada | 182,617 | 2,940,058 | 6.21% |
| 5 | Arizona | 423,056 | 6,931,071 | 6.10% |
| 6 | Hawaii | 73,927 | 1,428,557 | 5.17% |
| 7 | Montana | 50,145 | 1,042,520 | 4.81% |
| 8 | Alaska | 33,810 | 741,894 | 4.56% |
| 9 | Washington | 287,433 | 7,288,000 | 3.94% |
| 10 | Oregon | 153,936 | 4,093,465 | 3.76% |
| 11 | New Mexico | 69,617 | 2,081,015 | 3.35% |
| 12 | Colorado | 151,884 | 5,540,545 | 2.74% |
| 13 | California | 771,464 | 39,250,017 | 1.97% |
| 14 | North Dakota | 11,256 | 757,952 | 1.49% |
| 15 | Nebraska | 24,765 | 1,907,116 | 1.30% |
| 16 | Kansas | 37,632 | 2,907,289 | 1.29% |
| 17 | Texas | 348,130 | 27,862,596 | 1.25% |
| 18 | Oklahoma | 47,349 | 3,923,561 | 1.21% |
| 19 | South Dakota | 10,450 | 865,454 | 1.21% |
| 20 | Missouri | 70,389 | 6,093,000 | 1.16% |
| 21 | Virginia | 95,198 | 8,411,808 | 1.13% |
| 22 | Arkansas | 30,694 | 2,988,248 | 1.03% |
| 23 | West Virginia | 16,981 | 1,831,102 | 0.93% |
| 24 | Iowa | 28,157 | 3,134,693 | 0.90% |
| 25 | North Carolina | 84,902 | 10,146,788 | 0.84% |
| 26 | Georgia | 84,415 | 10,310,371 | 0.82% |
| 27 | Maine | 10,978 | 1,331,479 | 0.82% |
| 28 | South Carolina | 40,216 | 4,961,119 | 0.81% |
| 29 | Kentucky | 34,954 | 4,436,974 | 0.79% |
| 30 | Alabama | 37,237 | 4,863,300 | 0.77% |
| 31 | Florida | 154,921 | 20,612,439 | 0.75% |
| 32 | Tennessee | 50,030 | 6,651,194 | 0.75% |
| 33 | Mississippi | 21,849 | 2,988,726 | 0.73% |
| 34 | Vermont | 4,548 | 624,594 | 0.73% |
| 35 | Maryland | 43,534 | 6,016,447 | 0.72% |
| 36 | Indiana | 44,669 | 6,633,053 | 0.67% |
| 37 | New Hampshire | 8,668 | 1,334,795 | 0.65% |
| 38 | Louisiana | 29,934 | 4,681,666 | 0.64% |
| 39 | Minnesota | 32,719 | 5,519,952 | 0.59% |
| 40 | Delaware | 5,400 | 952,065 | 0.57% |
| 41 | Ohio | 61,490 | 11,614,373 | 0.53% |
| 42 | Wisconsin | 26,392 | 5,778,708 | 0.46% |
| 43 | Illinois | 57,109 | 12,801,539 | 0.45% |
| 44 | Michigan | 44,662 | 9,928,300 | 0.45% |
| 45 | Connecticut | 15,834 | 3,576,452 | 0.44% |
| 46 | New York | 81,741 | 19,745,289 | 0.41% |
| 47 | District of Columbia | 2,758 | 681,170 | 0.40% |
| 48 | Massachusetts | 27,204 | 6,811,779 | 0.40% |
| 49 | Pennsylvania | 51,666 | 12,784,227 | 0.40% |
| 50 | Rhode Island | 4,070 | 1,056,426 | 0.39% |
| 51 | New Jersey | 33,478 | 8,944,469 | 0.37% |


