States With The Lowest Home Ownership Rates

There is a wide range of residential options available to US citizens to live in today. Americans can own their own houses, rent an apartment from others, sign a limited lease, or choose from a number of other options to meet their needs. Recently, polls and surveys have been conducted to determine the percentage of the least housing units occupied by their owner in the US on a state-to-state basis. Despite the fact that some of the residents accounted for in these statistics may have made their choices in homes based on personal preference or lifestyle decisions, on a large-scale, trends in housing characteristics can lead us to conclusions about the residential patterns of each state and the people who inhabit them.
Dense Populations Correlate With Low Ownership Rates
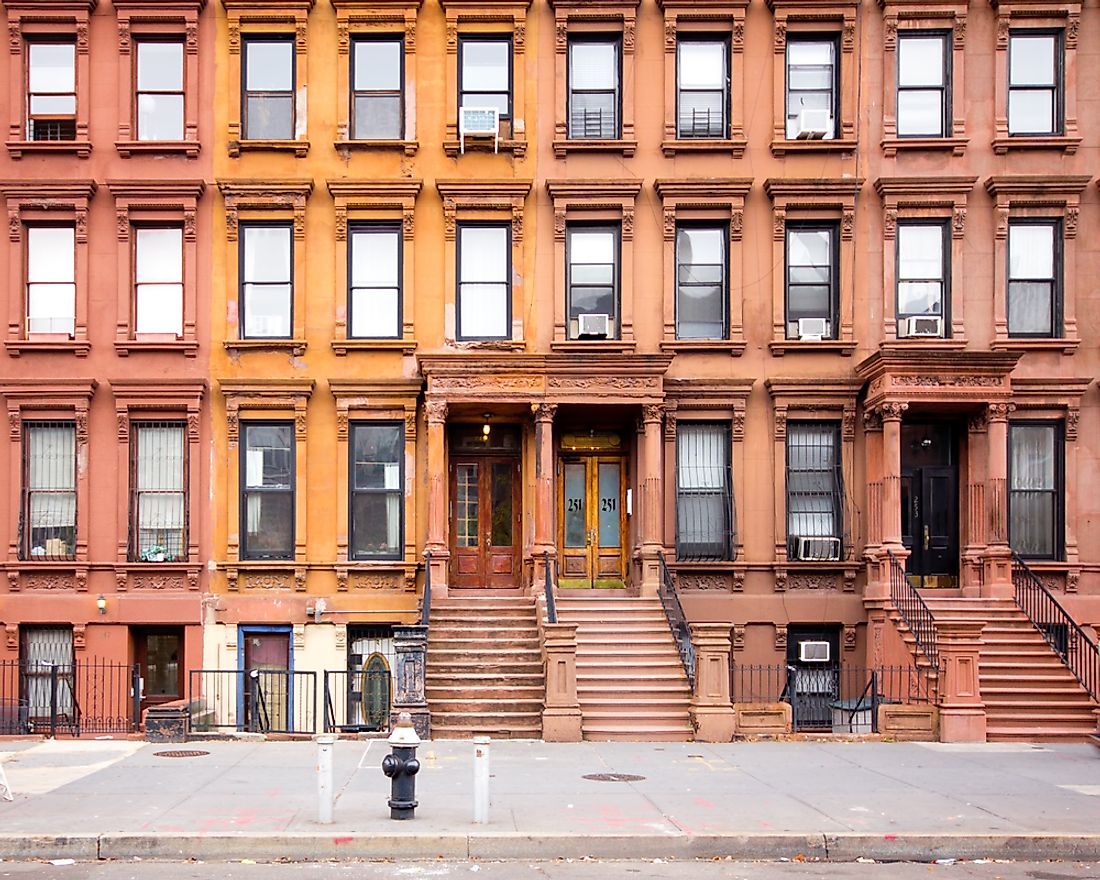
New York, for instance, is the state with the lowest percentage of housing units occupied by their owners, at 54.3%. While this might be alarming at first, if one takes into consideration the huge population of New York City and the extreme disparity in availability of apartments as compared to houses within it, such a high percentage starts to make a great deal of sense. The same can be inferred from the next two on the list, California and Nevada, both of which are home to megalopolises, such as Los Angeles and Las Vegas, respectively, among others. The larger or more concentrated cities and centers of population are within a state relative to the total population of a state, the higher the number of apartments per capita will usually be. Since apartment complexes are usually owned by a single party and then rented to numerous dwellers, this leaves a decreased chance of housing units being occupied by their owners in highly urbanized states. This trend can be observed in many of the states on the list that have some of the country’s largest cities, such as Texas (Houston, Dallas, and Austin), Arizona (Phoenix), and Illinois (Chicago) all appearing within the bottom half of states where the proportions of home owners among all occupants is lowest.
The College Factor
At a rate of 58%, Hawaii comes in at fourth on the list. Featuring a lack of major cities, the low percentage can be accounted for by way of the regular influx of tourists and temporary residents every year, and high costs of living therein. Additionally, the amount of colleges per capita should definitely be taken into consideration, which likely accounts in large part for Massachusetts’ place at sixth on the list, as most college students rent their respective residences. Despite being the sixth smallest state in terms of land area, Massachusetts has well over 100 colleges, creating a huge influx of students, most of whom dwell in temporary residences.
General Trends Toward Decreased Ownership Rates
Overall, states with more urban centers and temporary residents are among the most likely to have the lowest percentages of their housing units occupied by their respective owners. While this might not be a huge cause for concern, with a trend towards urbanization and gravitation towards cities throughout the country, we are likely to only see these percentages decrease over time. This trend could also be inferred as an indicator of fiscal classism, wherein the country’s wealthiest own more and more of American real estate, while those who are less well-off are unable to afford the purchase of their own homes or properties. Again, it is important to note that choice of home can be nothing more than personal preference, and is not necessarily dictated by outside circumstance or lack of ability to buy one’s own property. Nonetheless, housing opportunities available where one lives may often supersede such inclinations.
Home Ownership Rates By State
| Rank | State | Housing Units Occupied by Owner (%) |
|---|---|---|
| 1 | New York | 54.3 % |
| 2 | California | 55.6 % |
| 3 | Nevada | 57.2 % |
| 4 | Hawaii | 58.0 % |
| 5 | Rhode Island | 60.8 % |
| 6 | Massachusetts | 62.2 % |
| 7 | Oregon | 62.5 % |
| 8 | Washington | 63.1 % |
| 9 | Texas | 63.6 % |
| 10 | Alaska | 63.9 % |
| 11 | Arizona | 65.2 % |
| 12 | Colorado | 65.9 % |
| 13 | Georgia | 66.2 % |
| 14 | New Jersey | 66.4 % |
| 15 | North Dakota | 66.9 % |
| 16 | Maryland | 67.0 % |
| 17 | North Carolina | 67.2 % |
| 18 | Arkansas | 67.4 % |
| 19 | Nebraska | 67.4 % |
| 20 | Louisiana | 67.6 % |
| 21 | Illinois | 67.7 % |
| 22 | Virginia | 67.7 % |
| 23 | Oklahoma | 67.8 % |
| 24 | New Mexico | 67.9 % |
| 25 | Connecticut | 68.0 % |


