Grocery Spending On Food By US State
The cost of cheese may rise and fall, but the value of ensuring your community remains well-fed is always priceless. Thankfully, the United States has nearly 1.9 million square miles worth of agricultural land, which is over half of its entire land area— in theory, abundant sources of livestock and produce should always be within reach of any citizen.
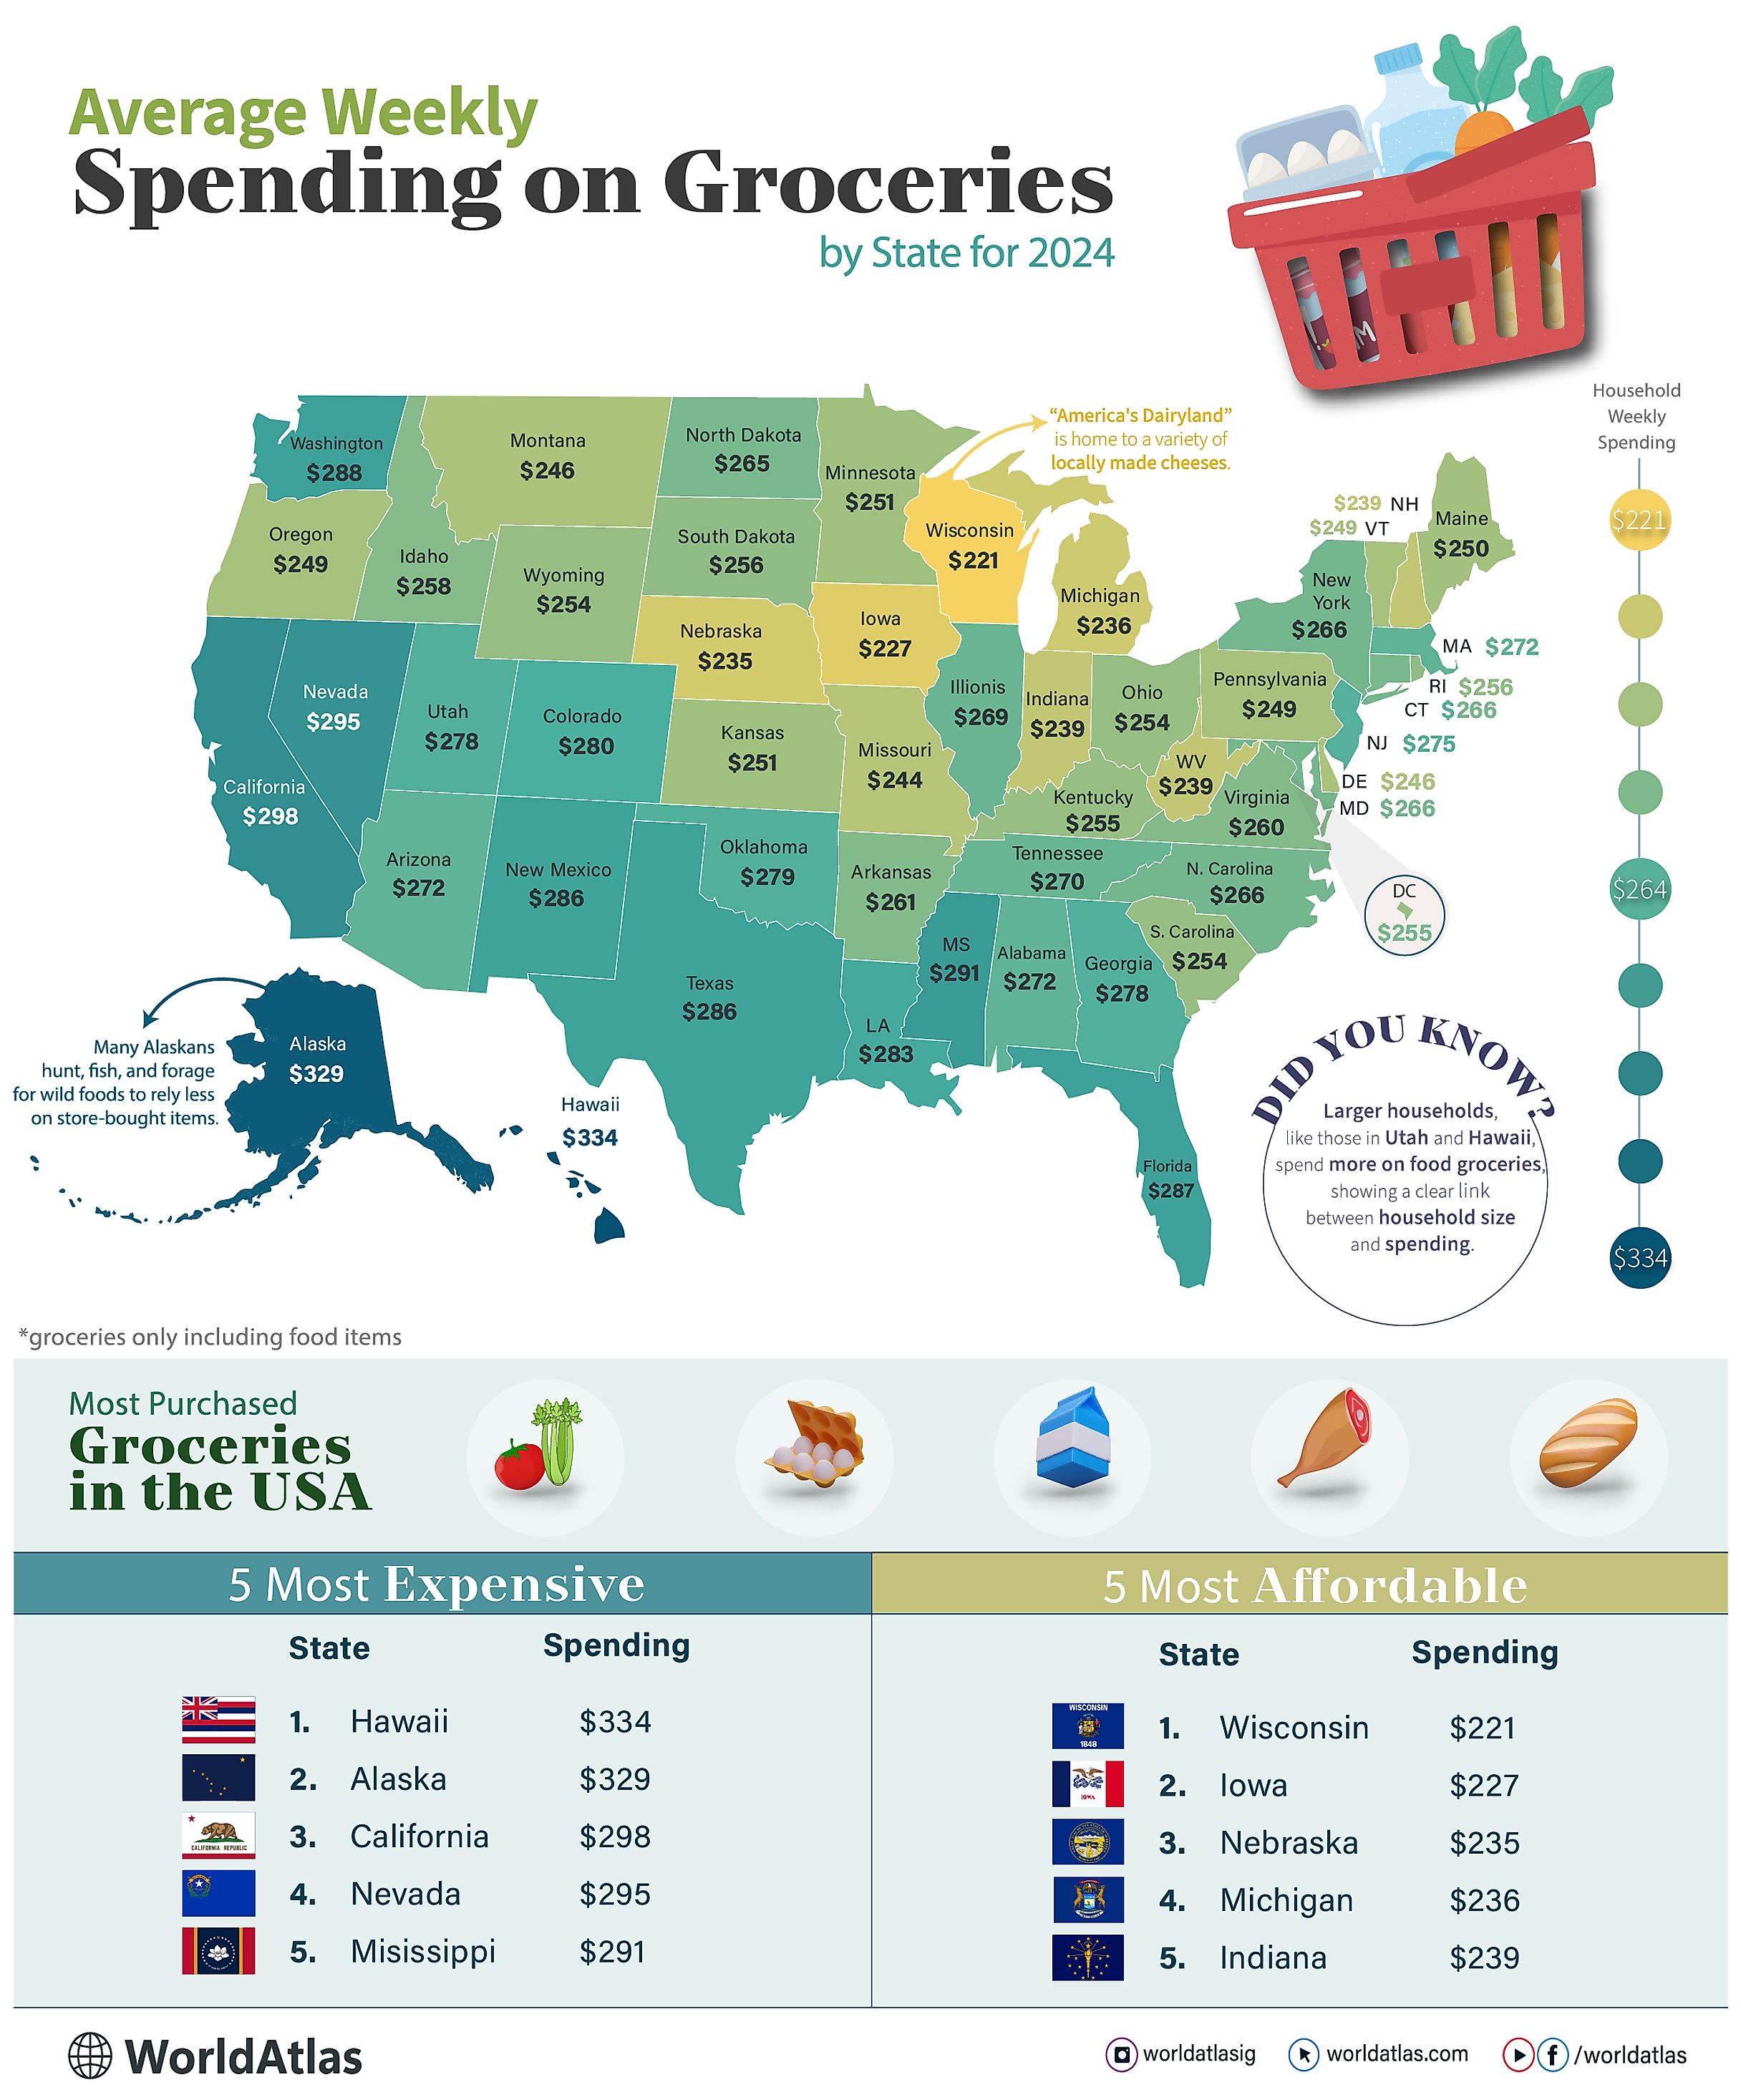
However, island states, separate from the contiguous mainland, provide evidence that transport costs can affect Americans despite a thriving agricultural industry. Other factors, such as higher minimum wages and choosing to cook at home, also play a major role in whether or not a household has a healthy budget. While a state like Hawaii has the highest average cost of groceries per week, at $334, Wisconsin is famously wallet-friendly, with an average cost of just $221 per week.
5 States with the Highest Spending on Food Groceries
| State | Average Weekly Groceries Cost |
|---|---|
| Hawaii | $334 |
| Alaska | $329 |
| California | $298 |
| Nevada | $295 |
| Mississippi | $291 |
1. Hawaii - $334/Week On Groceries
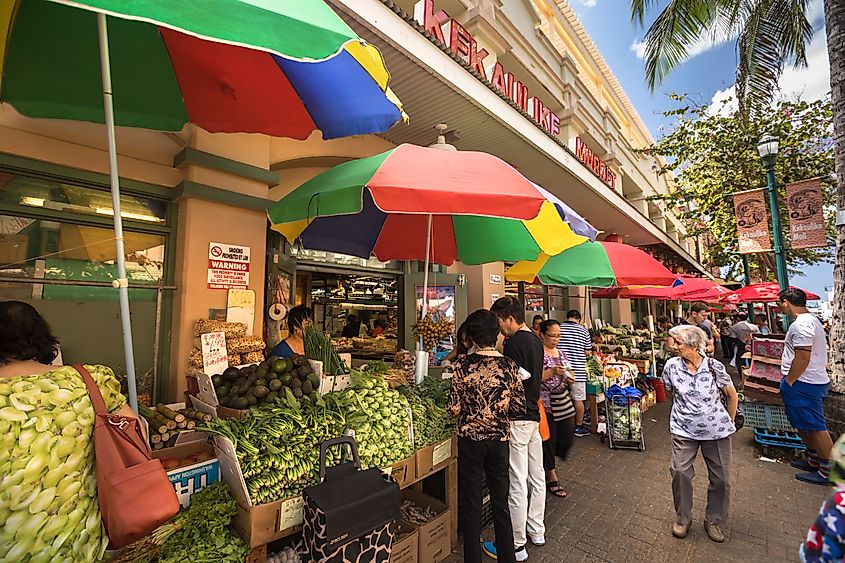
Due to Hawaii's average household size of 2.82 persons, 16% larger than the national average, there are simply more mouths to feed. Yet, the most obvious reason for the island chain's higher expenditure is its geographic distance from mainland USA, as it has to import 90% of all food consumed; the annual costs of these imports hover around $3 billion. Furthermore, the state's limited land area and the high value of its land for tourism reduce available space for agriculture, increasing reliance on imported fresh and diverse foods, which further inflates prices. Compounding on these factors is the state's general excise tax of 4% on all business activities, which adds more pressure to household wallets.
2. Alaska - $329/Week On Groceries
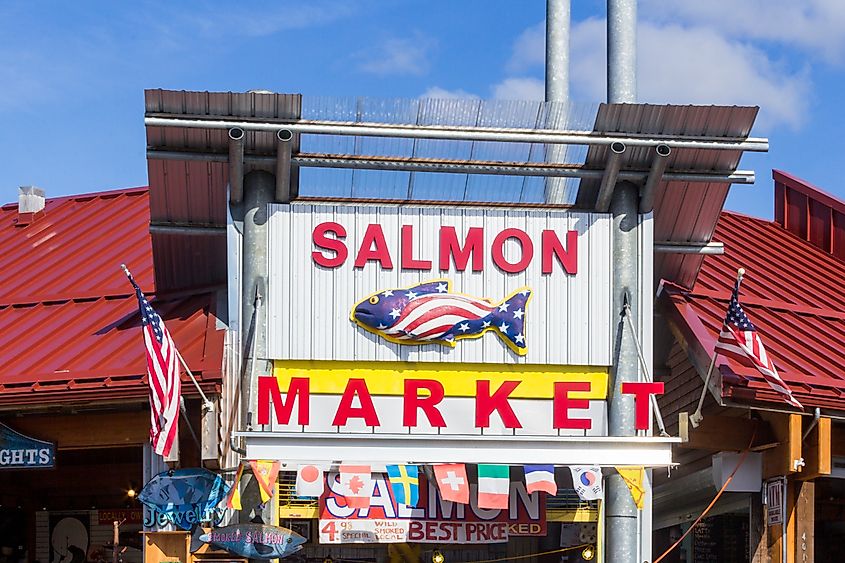
Unionization, permanent fund dividends, government employment, and heavy industries: these conditions have raised Alaska's median household income to $86,631, the 13th highest in the nation, and groceries are, therefore, more expensive simply by demand. It is by no coincidence that the second state, disconnected from the contiguous United States, ranks #2 in grocery bills, with import costs being extreme. Furthermore, due to the dramatic geography and climate of Alaska, which sits far closer to the Arctic Circle than other states, many remote regions are food deserts that further depend on expensive imports that must traverse over difficult terrain. To put the issue of scarcity into perspective, Alaska is dead last when comparing all states by farmland percentage, with just 0.23% of its area dedicated to agriculture.
3. California - $298/Week On Groceries

It will come as no surprise to many that California has stringent environmental regulations, and ultimately, that means agriculture and the supply chains that stock markets with groceries simply demand a bigger budget. Closer to home is the farm-to-table movement that sprung up in the 1960s around the California restaurant Chez Panisse, and this is a cultural preference to purchase locally sourced products. These eco-friendly goods, such as groceries, can carry a higher price tag because they do not benefit from the large-scale operations found in nationwide produce franchises. Higher minimum wages, as well as California's own share of food deserts, are also direct explanations of why California comes in as the third-highest state for grocery expenses.
4. Nevada - $295/Week On Groceries

Although Nevada focuses on range livestock production, its climate is remarkably arid, and thus, fresh produce is naturally more expensive. Compounding with that issue are the urban demands of Las Vegas and Reno, which seek out pricey specialty foods at a significant rate that can bump-up purchasing statistics. In theory, Nevada excludes groceries from state taxes, but this only targets unprepared foods; meals that are heated, mixed into a single item, or sold with utensils are still taxed at 6.85%.
5. Mississippi - $291/Week On Groceries

Although Mississippi's median household income of $52,985 is significantly below the U.S. average of $75,149, the state still struggles greatly with high food costs. Therefore, the impact is greater when residents have to spend a higher income share on food each week, especially with slightly higher household sizes than the national average. Many people in Mississippi purchase groceries from convenience stores because their neighborhoods are considered food deserts, which have low access to affordable supermarkets. The final blow comes from the state's 7% grocery tax, which is the highest nationally, and the issue is exacerbated by high poverty with a 13.8% reliance on SNAP (originally known as the Food Stamp Program).
5 States with the Lowest Spending on Food Groceries
| State | Average Weekly Groceries Cost |
|---|---|
| Wisconsin | $221 |
| Iowa | $227 |
| Nebraska | $235 |
| Michigan | $236 |
| Indiana | $239 |
1. Wisconsin - $221/Week On Groceries

Wisconsin households have the lowest weekly grocery expense in America because Wisconsin is not reliant on a single saving grace— the state has a host of advantages that positively compound together. In short, Wisconsin has a low cost of living, smaller household sizes (2.31 persons), close proximity to Midwestern agriculture producers that benefit from subsidies, competitive grocery markets, and a cultural focus on home-cooked meals. The strength of its agricultural industry comes from a powerful history of geography and culture. Abundant freshwater, fertile soil, and extensive plains and forests are ideal for large farms to flourish. Moreover, the state's original 19th-century German and Scandinavian settlers brought advanced farming techniques, particularly in the dairy industry, hence the amusing moniker "cheesehead."
2. Iowa - $227/Week On Groceries
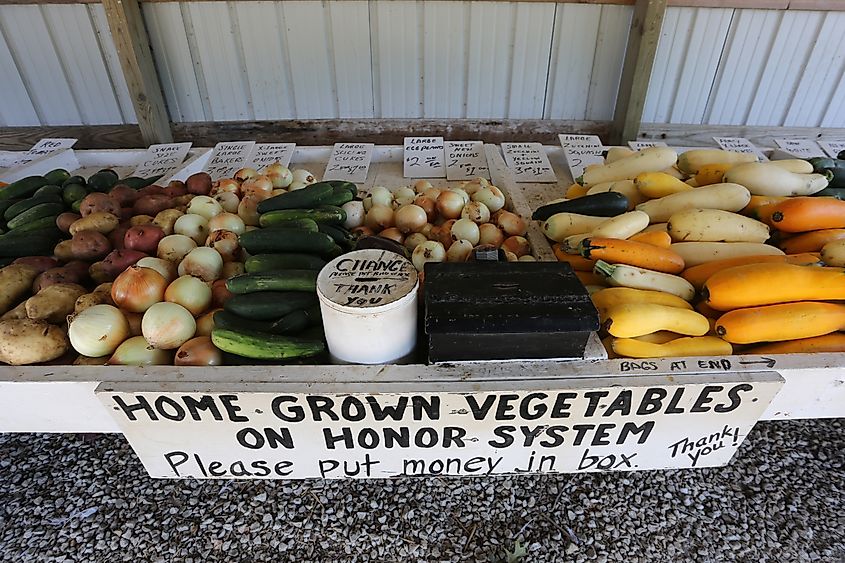
Over 85% of Iowa is made up of farmland, making it 5th in the nation for farmland percentage relative to its land area, based on NASS/USDA data. This greatly aids Iowa's communities in regards to their proximity to supply and distribution. This works twofold with the fact that Iowans spend more on home cooking than delivery or restaurants, on average, which they only spend $81/week on. Other figures in Iowa are similar; in general, the cost of living is estimated to be 6% lower than national averages, with the costs of clothes and utilities at 3% and 5% lower, respectively.
3. Nebraska - $235/Week On Groceries

At #1 for its farmland-to-land area ratio, at 91.12%, Nebraskans are practically overwhelmed with bounty. Furthermore, that abundance offsets the fact that the median household income is almost exactly in line with the national average, meaning that economic forces are not enough to sway grocery expenses higher. In regards to the tendency for Nebraskans to shop at farmer's markets and prepare their own meals, it is clear that the state's social values prioritize cost-efficiency. So, what does Nebraska produce on these endless farms? "It is a national leader in producing soybeans, wheat, dry edible beans, pork, grain sorghum, popcorn, and eggs," according to the Nebraska Department of Agriculture.
4. Michigan - $236/Week On Groceries
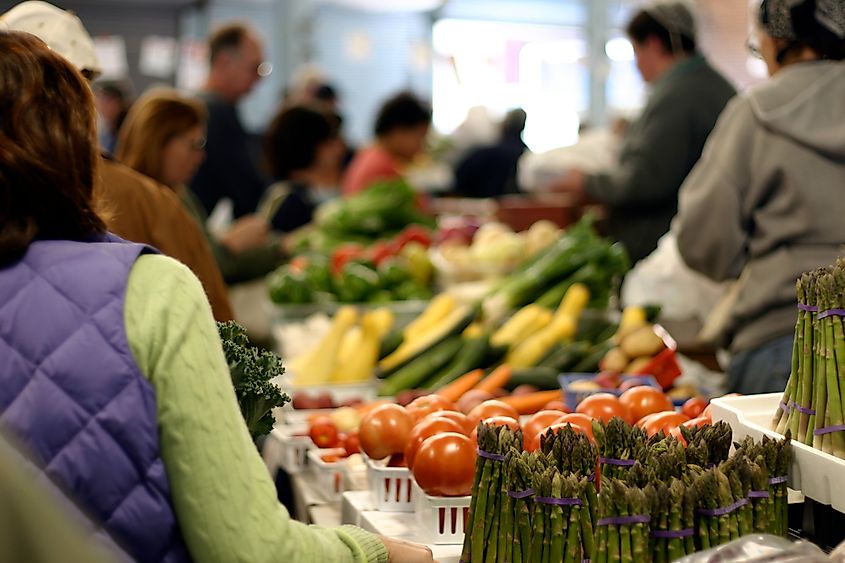
In contrast, Michigan is 30th for farmland, with only 26.61% of the state's land utilized for agriculture. However, because its household size is 2.39, its median household income is $69,183, and thus, each is below the U.S. average, groceries tend to be slightly more affordable. However, some areas like Wayne County see child food insecurity rates as high as 21.6%, so despite cheaper meals, these regions still suffer at a scale 47.9% higher than the national average. A worthy conclusion is that the base prices of goods are never the whole picture when assessing the ability of citizens to access regular nutrition.
5. Indiana - $239/Week On Groceries

Indiana has a culture of neighbor-to-neighbor support. Food banks and community efforts to support those in need are reliable— in 2021, the Food Bank of Northern Indiana distributed 10.4 million pounds of food to its network of 125 member agencies. So, like Michigan, despite the lower cost of groceries, it is estimated that nearly a million people in Indiana face hunger, including 285 thousand children. Regarding distribution, Indiana is centered in the Midwest, so it benefits from distribution networks that are not as typical in remote states, such as Alaska.
Final Thoughts
The relationship between grocery costs and hunger in the United States is intriguing— one might assume that lower costs automatically equal reduced rates of hunger, but this is not always true. However, states like Indiana prove that community support makes weathering through such difficulties more possible, and states like Wisconsin show that cooking meals at home is key to financial savings. In remote states or cities with higher minimum wages, however, be prepared to budget more for food needs.
US States Ranked By Average Cost Of Weekly Groceries
| State | Mean Spending on Food Groceries (USD) |
|---|---|
| Hawaii | 334 |
| Alaska | 329 |
| California | 298 |
| Nevada | 295 |
| Mississippi | 291 |
| Washington | 288 |
| Florida | 287 |
| New Mexico | 286 |
| Texas | 286 |
| Louisiana | 283 |
| Colorado | 280 |
| Oklahoma | 279 |
| Georgia | 278 |
| Utah | 278 |
| New Jersey | 275 |
| Alabama | 272 |
| Arizona | 272 |
| Massachusetts | 272 |
| Tennessee | 270 |
| Illinois | 269 |
| Connecticut | 266 |
| Maryland | 266 |
| New York | 266 |
| North Carolina | 266 |
| North Dakota | 265 |
| Arkansas | 261 |
| Virginia | 260 |
| Idaho | 258 |
| Rhode Island | 256 |
| South Dakota | 256 |
| Washington DC | 255 |
| Kentucky | 255 |
| Ohio | 254 |
| South Carolina | 254 |
| Wyoming | 254 |
| Kansas | 251 |
| Minnesota | 251 |
| Maine | 250 |
| Oregon | 249 |
| Pennsylvania | 249 |
| Vermont | 249 |
| Delaware | 246 |
| Montana | 246 |
| Missouri | 244 |
| Indiana | 239 |
| New Hampshire | 239 |
| West Virginia | 239 |
| Michigan | 236 |
| Nebraska | 235 |
| Iowa | 227 |
| Wisconsin | 221 |
States Ranked By Highest Farmland Percentage
| Rank | State | % Farmland |
|---|---|---|
| 1 | Nebraska | 91.12% |
| 2 | South Dakota | 89.04% |
| 3 | North Dakota | 88.99% |
| 4 | Kansas | 87.34% |
| 5 | Iowa | 85.32% |
| 6 | Oklahoma | 78.36% |
| 7 | Illinois | 75.99% |
| 8 | Texas | 75.36% |
| 9 | Indiana | 64.55% |
| 10 | Missouri | 62.51% |
| 11 | Montana | 62.16% |
| 12 | Ohio | 51.62% |
| 13 | New Mexico | 51.53% |
| 14 | Kentucky | 51.05% |
| 15 | Minnesota | 49.84% |
| 16 | Colorado | 47.94% |
| 17 | Wyoming | 46.67% |
| 18 | Delaware | 42.49% |
| 19 | Arkansas | 42.04% |
| 20 | Wisconsin | 40.97% |
| 21 | Tennessee | 40.55% |
| 22 | Arizona | 36.04% |
| 23 | Mississippi | 34.63% |
| 24 | Washington | 34.09% |
| 25 | Maryland | 32.19% |
| 26 | Virginia | 30.47% |
| 27 | Louisiana | 28.93% |
| 28 | Florida | 28.26% |
| 29 | Georgia | 27.71% |
| 30 | Michigan | 26.81% |
| 31 | Hawaii | 26.76% |
| 32 | North Carolina | 26.67% |
| 33 | Oregon | 25.56% |
| 34 | Pennsylvania | 25.49% |
| 35 | Alabama |
25.3% |
| 36 | South Carolina | 24.95% |
| 37 | California | 24.27% |
| 38 | New York | 22.88% |
| 39 | West Virginia | 22.75% |
| 40 | Idaho | 21.74% |
| 41 | Utah | 20.35% |
| 42 | Vermont | 20.34% |
| 43 | New Jersey | 15.94% |
| 44 | Connecticut | 12.26% |
| 45 | Massachusetts | 10.02% |
| 46 | Rhode Island | 9.07% |
| 47 | Nevada | 8.68% |
| 48 | New Hampshire | 7.5% |
| 49 | Maine | 6.59% |
| 50 | Alaska | 0.23% |


