10 Poorest States in the US
With the national median household income of the United States being $80,610, how do the poorest states compare? In the US, 11.6% of the population lives under the poverty line. Some of the poorest states on this list, such as Mississippi and West Virginia, earn nearly $20,000 less than the national median, causing a significant shift in stability and quality of life.
In this article, we will dive into the reality of these poorest states and examine the causes of these deflated incomes as well as their impact on the quality of life of the average resident.
10 Poorest US States
| State | Median Household Income |
|---|---|
| Mississippi | $54,203 |
| West Virginia | $55,948 |
| Louisiana | $58,229 |
| Arkansas | $58,700 |
| Kentucky | $61,118 |
| Oklahoma | $62,138 |
| Alabama | $62,212 |
| New Mexico | $62,468 |
| Tennessee | $67,631 |
| Ohio | $67,769 |
Mississippi
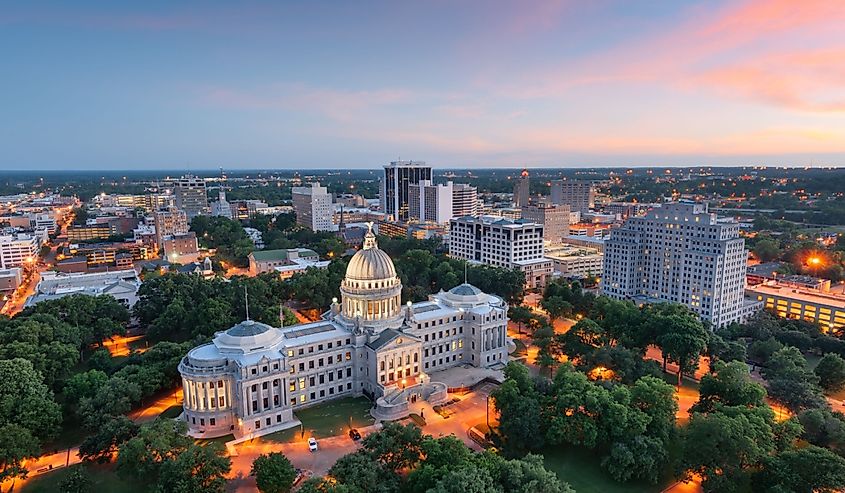
In the Southeastern United States, Mississippi has a median income of $54,203, making it the state with the lowest income countrywide. Poverty is high, as 18% of the population lives under the poverty line. Mississippi is also known as being one of the hungriest states, as 20% of the population is food insecure, meaning that one out of every five people in the state does not have access to sufficient food or adequate food quality. With 35% of Mississippi’s land dedicated to farmland, the biggest industry in the state is agriculture. Manufacturing and fishing are also important industries. This lack of diversification in economic activities makes Mississippi vulnerable, specifically in the face of natural disasters such as hurricanes, floods, and fires. Lack of adequate education is another key factor contributing to persistent economic difficulties. In good news, the percentage of students who have earned their high school diploma is at an all-time high in the state. The high school dropout rate decreased by 8.5%, with 89.4% of students completing high school.
West Virginia
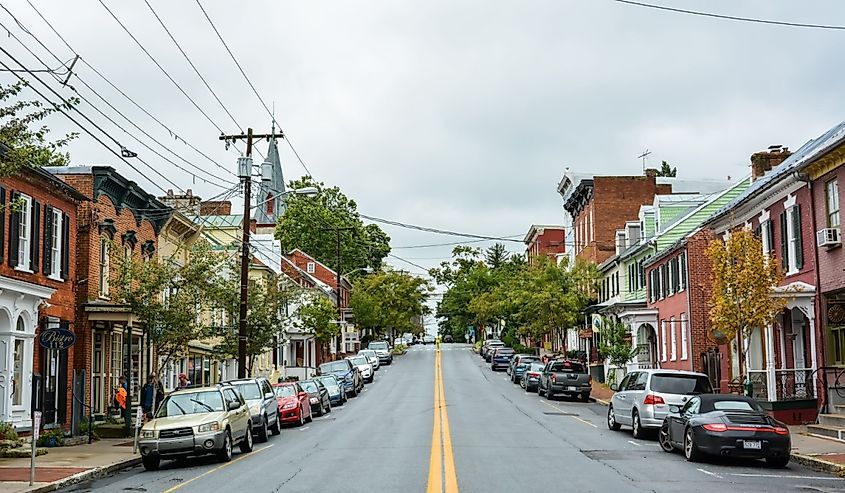
West Virginia, located in the Appalachian region of the US, has a median income of $55,948 and a poverty rate of 16.7%. The government is the largest employer in the state, representing about one-fifth of all jobs. However, West Virginia’s dependence on the energy and mining industries has proven to be a weakness over the years due to decreasing energy prices and a decline in the coal industry. Introducing more renewable energy into the market has been difficult, as many West Virginians see it as competition to the coal industry. Another challenge in the state has been infrastructure. Infrastructure built during the last 70 years, such as roads, bridges, and drinking water systems, continues to age. Due to declining population numbers, West Virginians have had difficulties making repairs and updates. This decline results in smaller tax funds to make necessary repairs and limits the state’s advancement opportunities.
Louisiana
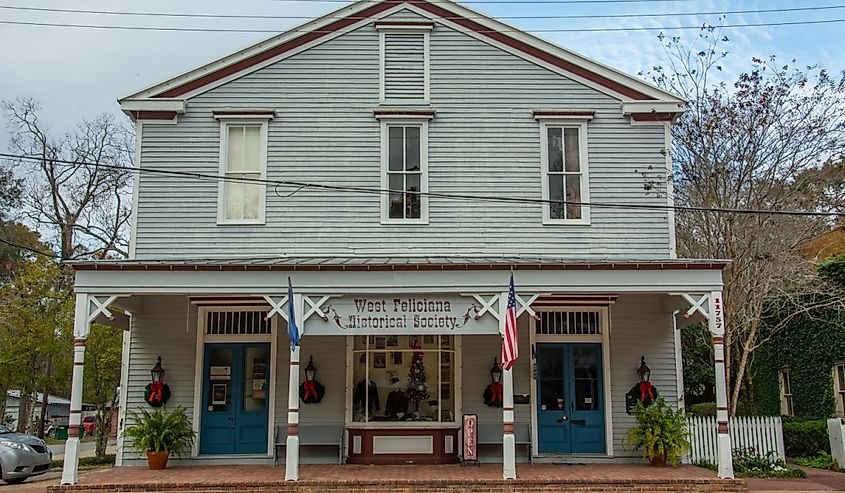
Louisiana, a state in the southern US, has a median household income of $58,229. Around 18.9% of residents are below the poverty line. A majority of this crisis, however, takes place in rural regions of the state, as 59% of rural residents are either below the poverty line or unable to meet their basic needs. Chemical and energy products are some of Louisiana’s biggest industries, and manufacturing represents approximately one-sixth of the state’s GDP. These factors have caused economic crises in light of global market fluctuations. Similar to other states on this list, an inadequate public education system has perpetuated poverty and low wages.
Arkansas
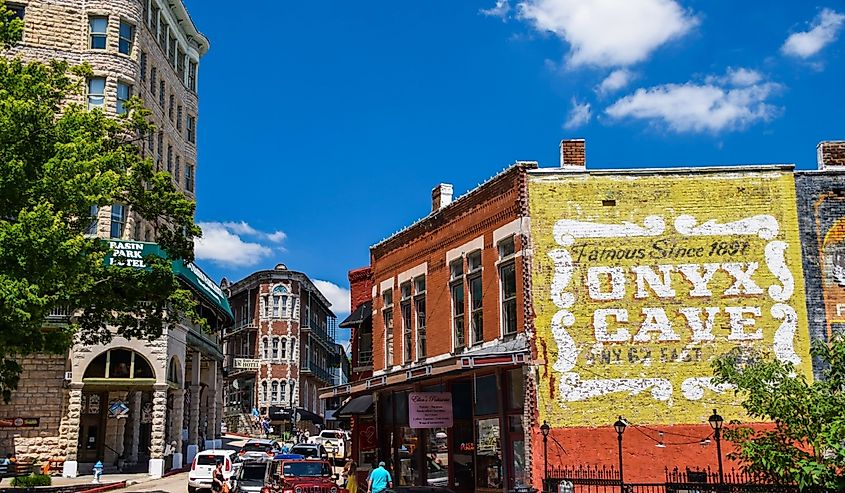
The southern central US state of Arkansas has a household median income of $58,700, ranking it the fourth lowest. Additionally, 15.9% of individuals live below the poverty line. Similar to Mississippi, agriculture is the largest industry in the state, representing $16 billion in statewide revenue. With 56% of land being forest, forestry is also an important industry. Unfortunately, the jobs available in these industries often have low wages, contributing to the low median income. A lack of access to quality education and healthcare is also largely to blame for Arkansas’ complicated economic situation.
Kentucky

The east-south-central state of Kentucky ranks 5th among the poorest states, with a median household income of $61,118 and a poverty rate of 15.8%. Like West Virginia, Kentucky is heavily dependent on the manufacturing and coal mining industries, which has caused hardship in recent years due to the gradual shift towards renewable energy. Additionally, due to climate change, droughts are becoming longer and floods more frequent, causing a reduction in crop yields for crops such as tobacco and corn. With agriculture being one of Kentucky’s leading industries, this reduction has had a heavy economic impact. In terms of both K-12 education, Kentucky frequently ranks near the bottom of states regarding literacy levels, funding, and student performance which also has a long-term impact on household income levels.
Oklahoma
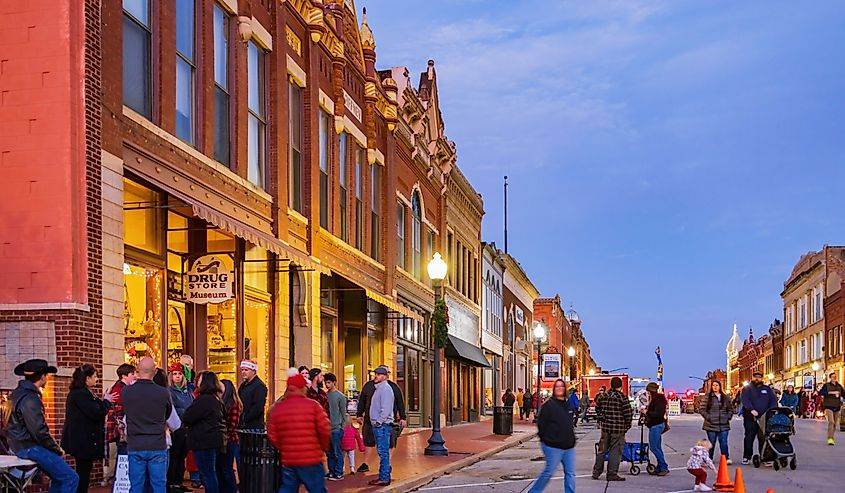
Oklahoma, situated in the southwest region of the US, has a median household income of $62,138. Poverty has been ongoing in Oklahoma since the beginning of its statehood due to historic drought, a lack of material resources, and poor infrastructure. Today, 15.9% of the population lives below the poverty line. One issue that leads to this economic instability and poverty is unemployment and lack of adequate employment opportunities. People of color and residents of Eastern Oklahoma both suffer unemployment at much steeper rates. Additionally, nearly one in three employees earn a median wage that places them below the poverty line. Problems with the education system are intertwined with low wages and unemployment. Oklahoma is one of the lowest-ranking states in terms of education spending per pupil, resulting in a neglected educational infrastructure.
Alabama

Alabama, a state located in the heart of the US South, has a median household income of $62,212. 15.7% of individuals in the state live below the poverty line. Much of the state’s inequality is a result of its agricultural history, which is rooted in slavery, racial discrimination, and segregation. The state, once heavily dependent on cotton plantations, was responsible for the massive enslavement of Africans. In fact, at one point during the 19th century, nearly half of Alabama’s population were slaves. Although Alabama abolished slavery in 1865, the aftermath of this slavery continues in the present, specifically affecting African American populations, who have a much higher rate of being below the poverty line. Activists in Alabama are attempting to improve this reality by pushing for more inclusive education and changes in legislation across the state.
New Mexico
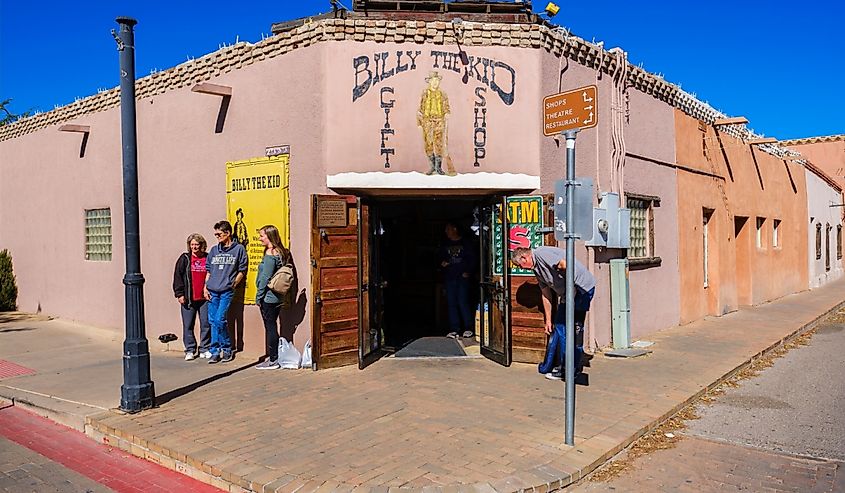
New Mexico, located in the southwestern US, has a median household income of $62,468, and 17.8% of residents live under the poverty line. With this number in mind, poverty, and economic hardship is much higher for Native Americans in the state. Around 31% of Native Americans live in poverty, which is much higher than the overall state average. The state heavily relies on employment in the public sector; about one out of every five workers is a public sector employee. The education system is one of the biggest causes of economic instability and poverty in New Mexico. Only about 77% of students graduate from high school, and a mere 70.9% of adults have a proficient literacy level. This low graduation rate and lack of literacy locks many adults into low-wage jobs, limiting their career opportunities and causing a rise in homelessness and hunger.
Tennessee

Tennessee is 9th on the list with a median household income of $67,631. Tennessee’s poverty rate is the lowest on this list at 14%, which is slightly lower than the national average rate of 11.5%. Poverty tends to be higher in rural areas and ranges greatly depending on the country. For example, the child poverty rate in Moore Country is only 3%, while it is a whopping 45% in Hancock. These geographical disparities also spread to school performance and literacy rates, with children in poorer counties being half as likely to score proficiently in reading compared to children from wealthier counties. The lack of equal educational opportunities perpetuates low wages and poverty in these counties.
Ohio
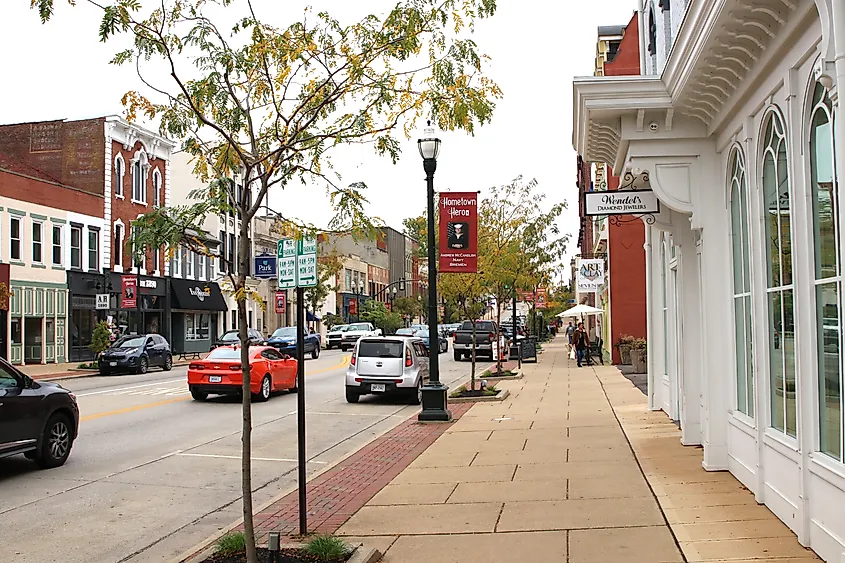
In the Midwestern United States, Ohio has a median household income of $67,769, ranking it as the 10th poorest state in the country. About 13.3% of the state's population lives below the poverty line, highlighting significant economic challenges. Ohio faces issues with economic diversity, with key industries including manufacturing, healthcare, and education, yet struggles to fully overcome economic disparities. The state is also known for its substantial agricultural output, particularly in soybeans and corn, which contribute to its economy but may also leave it vulnerable to fluctuations in global market prices and environmental factors. Educationally, Ohio is making strides, with improvements in high school graduation rates contributing to long-term economic prospects. From 2022 to 2023, the state saw a decrease in its high school dropout rate, which supports a broader effort to enhance workforce qualifications and attract higher-paying industries to the region.
Final Thoughts
In conclusion, examining the ten poorest states in the United States offers a sobering insight into the realities of economic hardship faced by millions of families. The disparities in income levels highlight the challenges it poses to individuals, families, and communities. These stark realities call for targeted policies and interventions to address the root causes of poverty and promote economic opportunity for all. By acknowledging and confronting these disparities, we can work towards building a more equitable society where every individual has the chance to thrive, regardless of their geographical location or socioeconomic background.
Data Source: US Census
US States Ranked By Median Household Income for 2024
| Rank | State | Median Household Income |
|---|---|---|
| 1 | Delaware | $108,210 |
| 2 | Massachusetts | $99,858 |
| 3 | New Jersey | $99,781 |
| 4 | Maryland | $98,678 |
| 5 | New Hampshire | $96,838 |
| 6 | California | $95,521 |
| 7 | Hawaii | $95,322 |
| 8 | Washington | $94,605 |
| 9 | Utah | $93,421 |
| 10 | Colorado | $92,911 |
| 11 | Connecticut | $91,665 |
| 12 | Virginia | $89,931 |
| 13 | Alaska | $86,631 |
| 14 | Minnesota | $85,086 |
| 15 | Rhode Island | $84,972 |
| 16 | New York | $82,095 |
| ** | DC | $81,361 |
| 17 | Vermont | $81,211 |
| 18 | Illinois | $80,306 |
| 19 | Oregon | $80,160 |
| 20 | Arizona | $77,315 |
| 21 | North Dakota | $76,525 |
| 22 | Nevada | $76,364 |
| 23 | Texas | $75,780 |
| 24 | Idaho | $74,942 |
| 25 | Georgia | $74,632 |
| 26 | Wisconsin | $74,631 |
| 27 | Nebraska | $74,590 |
| 28 | Pennsylvania | $73,824 |
| 29 | Maine | $73,733 |
| 30 | Florida | $73,311 |
| 31 | Wyoming | $72,415 |
| 32 | South Dakota | $71,810 |
| 33 | Iowa | $71,433 |
| 34 | Montana | $70,804 |
| 35 | North Carolina | $70,804 |
| 36 | Kansas | $70,333 |
| 37 | Indiana | $69,477 |
| 38 | Michigan | $69,183 |
| 39 | Missouri | $68,545 |
| 40 | South Carolina | $67,804 |
| 41 | Ohio | $67,769 |
| 42 | Tennessee | $67,631 |
| 43 | New Mexico | $62,468 |
| 44 | Alabama | $62,212 |
| 45 | Oklahoma | $62,138 |
| 46 | Kentucky | $61,118 |
| 47 | Arkansas | $58,700 |
| 48 | Louisiana | $58,229 |
| 49 | West Virginia | $55,948 |
| 50 | Mississippi | $54,203 |
